
CoT: Peek Into Future Through Futures, How Hedge Funds Are Positioned, Tuesday, July 7
Following futures positions of non-commercials are as of June 30, 2020.
10-year note: Currently net long 31k, up 24.5k.
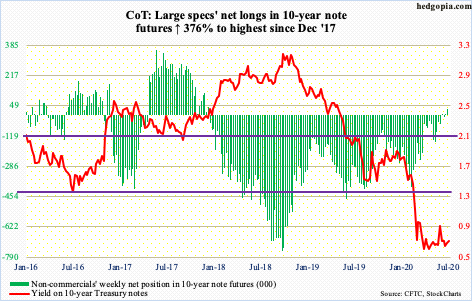
The 10-year Treasury yield cannot break the logjam. Since bottoming on March 9th at 0.40 percent, rates have pretty much been bound by 0.73 percent on the up and 0.59 percent on the down. The last time the 10-year (0.68 percent) yielded north of one percent was on March 20th. The June 5th high of 0.96 percent came close.
The Treasury has been issuing debt like there is no tomorrow, but with the economic outlook as uncertain as it is, it perhaps makes sense for rates to struggle to sustainably rally. At the same time, with the Fed aggressively buying Treasury notes and bonds, one would think rates would be lower. Yet, they have hung in there.
Non-commercials themselves seem confused. As recently as five months ago, they were net short 398,919 contracts. By June 9th, they were net long 2,254 contracts, with last Tuesday at 31,015. These traders cannot seem to make up their mind as to if they should remain net long or net short. Perhaps a sign of the times! Thanks to the Fed, market signals are increasingly distorted, and it is hard to decide what is signal and what is noise.
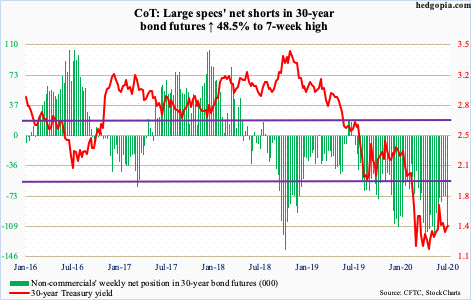
30-year bond: Currently net short 108.9k, up 35.6k.
Major economic releases for the remainder of this week are as follows.
JOLTS job openings (May) will be published later this morning. In April, non-farm openings tumbled 965,000 month-over-month to 5.05 million – the lowest since December 2014. Openings are down two million from January. They peaked at 7.52 million in January last year.
Friday brings the PPI (June). Producer prices rose 0.5 percent m/m in May and 3.1 percent in the 12 months to May. Core PPI over the same time period rose 0.1 percent and 2.6 percent, in that order.
WTI crude oil: Currently net long 656.2k, down 24.7k.
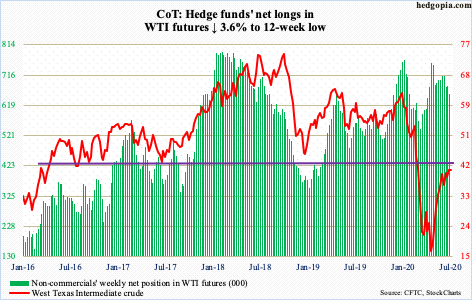
WTI ($40.63/barrel) essentially filled the gap from early March four weeks ago and subsequently went sideways around that level. The crude has had quite a rally since bottoming at $6.50 on April 21st. Given the extent of the move since that low, bulls likely treat the current sideways pattern as consolidation, hoping it eventually resolves with a breakout.
However, it is too soon to conclude bulls will prevail in this tug of war. We know this much. The daily Bollinger bands have narrowed to a level a sharp move is imminent – either up or down.
E-mini S&P 500: Currently net short 49.6k, down 47.5k.
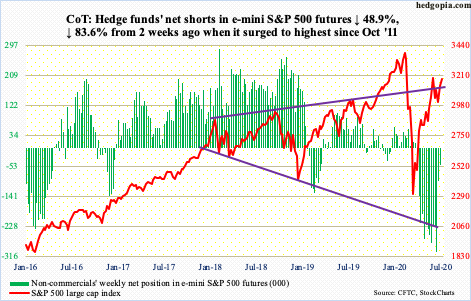
Until Monday, the S&P 500 was range bound between 3150s and 2950s for at least three weeks. On June 11th, with a gap-down, the index formed an island reversal as well as breached a rising wedge from the March low.
Yesterday, the index (3179.72) pushed through 3150s, albeit rather meekly with low volume; the 1.6-percent rally also helped fill the gap from June 11th. With that, the next thing to watch is if bulls will be able to defend the breakout in the sessions ahead. If they are able to build on it further, the June 8th high of 3233.13 is the new reference point, which approximates the daily upper Bollinger band.
Euro: Currently net long 99k, down 19.5k. (FXE)
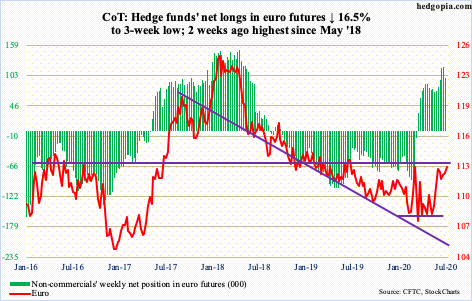
Last week, $111.70s-80s continued to draw bids; Thursday’s intraday high of $112.99 was rejected at a falling trend line from June when the euro ($113.10) tagged $114.25. For four to five weeks, the euro remained trapped within a flag/pennant. Yesterday, it broke out, although bulls were unable to hang on to all the gains, ending with a shooting star. They would have significantly improved their odds should $113.50s fall.
Gold: Currently net long 266.7k, up 14.7k. (GLD)
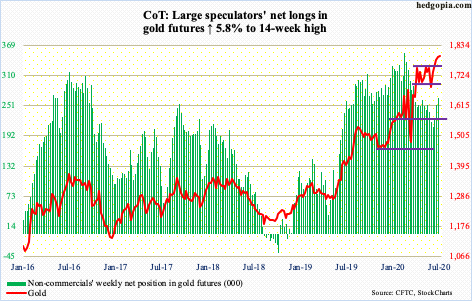
After trying for 11 straight weeks, gold ($1,793.50/ounce) broke out of $1,750s two weeks ago. The metal remains comfortably above that level, with gold bugs having defended the breakout both last week and the week before that. But as significant as that breakout probably was, the metal has not catapulted higher. Last week, in fact, gold rallied 0.5 percent but with a weekly long-legged doji.
The metal has come a long way, having dropped to $1,450.90 intraday on March 16th. In the event it proceeds to unwind its daily overbought condition, $1,750s, or between $1,700 and $1,750s, should generate buying interest.
Nasdaq 100 index (mini): Currently net long 43.8k, up 4.9k. (QQQ)
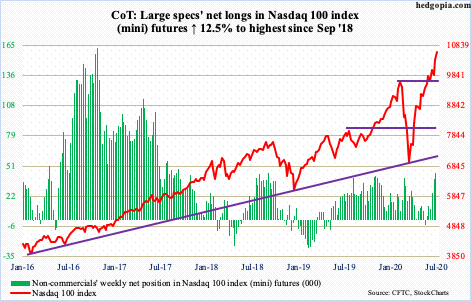
Along with the Nasdaq composite, the Nasdaq 100 is the only major US equity index to have surpassed its prior high from February. Intraday Monday last week, bulls aggressively defended that high, before rallying in the next five sessions, with a one-month rising wedge breakout yesterday. In just the past five session, the index jumped nine percent! Volume is low, but at this point price is what matters. Non-commercials have been adding to net longs.
Russell 2000 mini-index: Currently net long 19.7k, up 13.9k. (IWM)
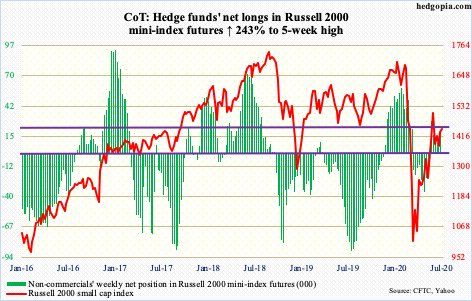
For the umpteenth of time since late May, rally attempts have been met by selling at/around 1450s. This occurred again last Thursday as well as yesterday; early last week, bids showed up at the lower bound of an ascending channel going back to March. A loss of this channel support opens the door to a test of horizontal support at 1330s, which bulls have used as an opportunity to go long for a month now. In other words, the Russell 2000 small cap index (1442.88) remains range bound between 1330s and 1450s.
US Dollar Index: Currently net short 5k, down 339.
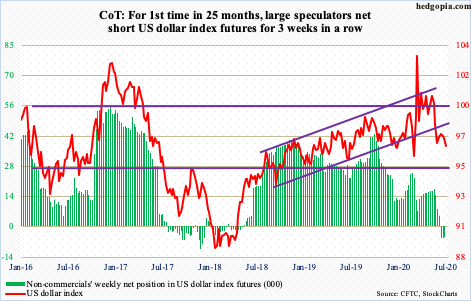
After three weekly hammers, the US dollar index (96.68) formed a spinning top last week. This preceded a drop from 103.96 on March 23rd to 95.70 on June 10th. Since that low, it has made higher lows, but rally attempts have been scuttled at 97.50s. Until that decisively gives way, unwinding of weekly oversold condition will have to wait.Immediately ahead, the daily seems to want to go lower.
VIX: Currently net short 71.4k, up 8.3k. (VIX)
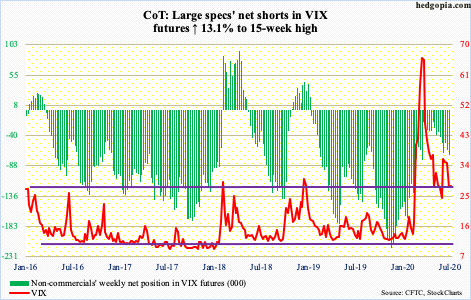
VIX’s March 18th intraday high of 85.47 was the highest since October 2008. Fear was rampant back then. Once stocks bottomed and volatility came in, VIX (27.94) proceeded to drop all the way to 23.54 by June 5th, which slightly undercut the 200-day but other than that it was a successful test. Once again, the average was tested last Thursday, and again yesterday – both successfully; Monday’s was a hammer reversal right on the daily lower Bollinger band. There is decent support at mid- to high-20s.
VIX acts like it wants to rally, but for volatility bulls to meaningfully build on Monday’s action, 36-37 needs to fall. This level has acted as resistance for two months now.
Thanks for reading!


