
CoT: Peek Into Future Through Futures, How Hedge Funds Are Positioned This Week
Following futures positions of non-commercials are as of March 12, 2019.
10-year note: Currently net short 176.4k, down 56.9k.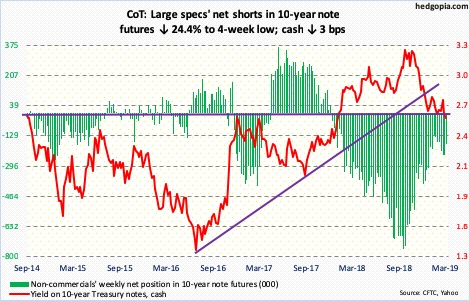
Non-commercials continue to cut back net shorts, which late September last year was at a new record. The 10-year Treasury yield (2.59 percent) fell three basis points in the week. Early October last year, these notes yielded 3.25 percent. Short-covering has helped. In the right circumstances for bond bulls, this can continue. They keep hammering on crucial support at 2.62 percent, which goes back a decade. The 10-year has essentially hugged this support for two and a half months now. Inability to rally off of this perhaps is a sign that bears are playing a weak hand. A decisive breakdown raises the odds that in due course the 10-year heads toward two percent.
30-year bond: Currently net short 22.6k, down 7.6k.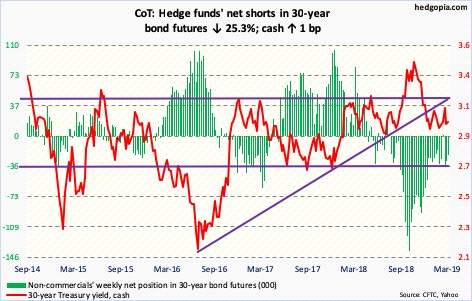
Major economic releases next week are as follows.
Monday brings the NAHB housing market index for March. Builder sentiment rose four points month-over-month in February to 62. Sentiment hit 74 in December 2017, which was the highest since July 1999.
On Tuesday, revised estimates of January’s durable goods are scheduled. Preliminarily in January, orders for non-defense capital goods ex-aircraft – proxy for business capex plans – grew 4.1 percent year-over-year. December’s 2.1-percent increase was a 23-month low.
Also on Tuesday, a two-day FOMC meeting begins. No change is expected in the fed funds rate – currently between 225 and 250 basis points.
February’s existing home sales are due out Friday. January’s fell 1.2 percent m/m to a seasonally adjusted annual rate of 4.94 million units. This was a third consecutive monthly drop. From a year ago, sales were down 8.5 percent.
Crude oil: Currently net long 476.7k, up 14.2k.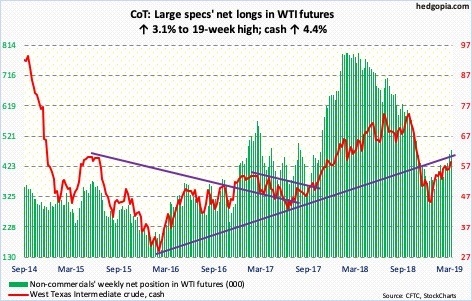
In the week ended March 8, US crude stocks fell by 3.9 million barrels to 449.1 million barrels. Gasoline stocks dropped by 4.6 million barrels to 246.1 million barrels. Crude production was lower by 100,000 barrels per day to 12 million bpd, even as crude imports declined by 255,000 bpd to 6.7 mbpd. Refinery utilization inched up one-tenth of a percentage point to 87.6 percent. Distillate stocks, however, rose by 383,000 barrels to 136.4 million barrels.
Overall, it was a positive report, and bulls responded. Wednesday – the day the EIA report was published – the cash ($58.52/barrel) rallied 2.4 percent. For the week, it was up 4.4 percent. There was decent resistance at $58, and that is gone, although a long-legged doji showed up Friday. The crude continues to remain trapped between its 50- and 200-day moving averages. In the meantime, daily Bollinger bands have narrowed quite a bit. More often than not, this is a precursor to a sharp move – either way. The weekly is getting extended.
E-mini S&P 500: Currently net short 66.9k, down 36.5k.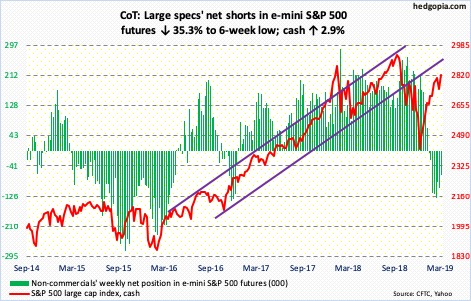
Last week’s drop was snapped up Friday near the daily lower Bollinger band. This week, the cash (2822.48) rallied 2.9 percent, nudging past 2800, but no decisive breakout just yet. The problem continues to be a lack of aggressive flows, even as the S&P 500 rallied 20 percent from the low of late December. Money-market funds boast $3.1 trillion in assets, up $73 billion since that low (courtesy of ICI). In the week to Wednesday, US-based equity funds attracted $891 million, but have bled $21 billion since late December (courtesy of Lipper). In the ETF land, from December 26 through Wednesday this week, three S&P 500-focused ETFs – SPY (SPDR S&P 500 ETF), VOO (Vanguard S&P 500 ETF) and IVV (iShares core S&P 500 ETF) – together lost nearly $15 billion (courtesy of ETF.com).
Investor sentiment similarly remains rather subdued despite the massive rally in stocks. This is ammo to those that argue the ongoing rally has no legs. On the other hand, if bulls succeed in staying the course, bears may be forced to change their tune. In this scenario, investor sentiment begins to rise and flows improve, as on-the-sidelines cash moves into stocks. Hence the significance of 2800-plus on the S&P 500. A decisive break has the potential to impact investor psyche. This also means that a lack thereof can swing risk-reward odds in bears’ favor.
Euro: Currently net short 75.7k, down 2.4k.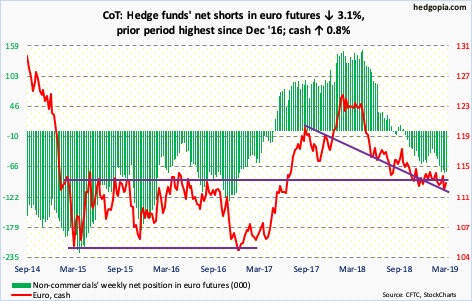
Thursday last week when the cash ($113.50) dropped one percent in response to the ECB announcement of a new stimulus program called TLTRO-III starting in September this year was pretty much the low. Through Friday’s intraday high of $113.51, the euro rallied 1.6 percent. But was that a wash-out low? Too soon to say.
Near term, there is room for the daily to rally. The currency remains under both the 50- and 200-day. With the 50-day at $113.67, a test seems imminent. Resistance is massive at $115, which is where the 200-day lies.
Gold: Currently net long 78.8k, down 9.2k.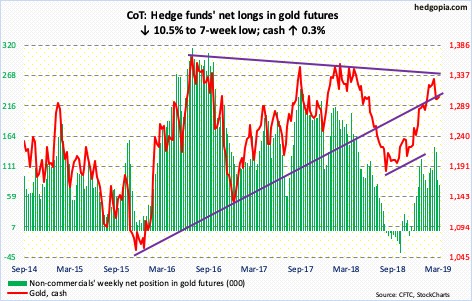
Bulls and bears continue to tussle over control of $1,300 on the cash ($1,302.90/ounce). The 50-day ($1,304.92) lies right around there. Hence the added significance of this level. Wednesday, the metal rallied above the average, but only to be pushed under in the next session.
In the week to Wednesday, GLD (SPDR gold ETF) took in $245 million. This followed loss of $2.4 billion in the prior five. In the same week, IAU (iShares gold trust) lost $26 million; this was a first negative week in 15 during which $1.2 billion came in (courtesy of ETF.com).
Flows are crucial for gold bugs to be able to not only stay above $1,300 but also attack $1,350-$1,360. A month ago, gold retreated from around that level, where multi-year resistance lies.
As a consolation for bulls, in the last three weeks non-commercials have cut back net longs substantially, yet the metal trades north of $1,300.
Nasdaq 100 index (mini): Currently net short 13.7k, down 7.6k.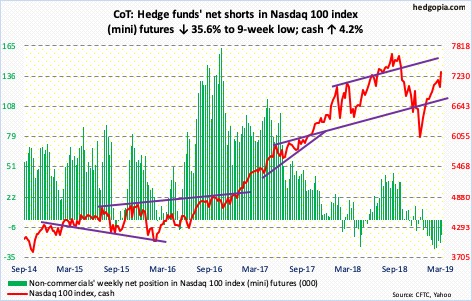
Since bottoming last Friday at the daily lower Bollinger band, the cash (7306.99) rallied strongly this week into – and past – the upper band. There is resistance at 7300. Bulls now have 7100-7200 as support for continued momentum, with the 200-day at 7077.72.
In the week through Wednesday, QQQ (Invesco QQQ trust) lost $874 million, having lost $678 million in the prior week (courtesy of ETF.com).
Russell 2000 mini-index: Currently net long 5.5k, up 542.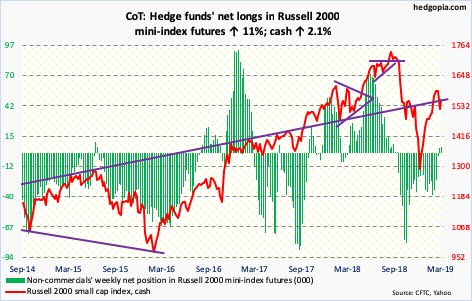
The cash (1553.54) rallied 2.1 percent this week, but action was listless. In late February-early March, the Russell 2000 small cap index failed at 1600, where resistance is significant. Small-cap bulls would at least like to test that ceiling again but did not even come close this week. Daily momentum indicators are struggling to cross the median. The weekly remains way overbought.
In the week through Wednesday, IJR (iShares core S&P small-cap ETF) lost $264 million. IWM (iShares Russell 2000 ETF) gained $314 million; this followed redemption of $4.3 billion in 10 weeks, during which only one week was positive (courtesy of ETF.com).
US Dollar Index: Currently net long 35.1k, up 1.4k.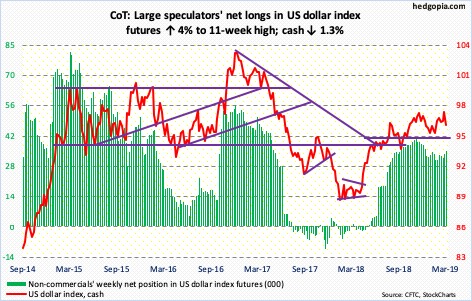
On Thursday last week, post-ECB announcement of the aforementioned stimulus, the cash (96.05) jumped 0.9 percent, with an intraday of 97.67. And that was it. That high was not even tested in subsequent sessions. In fact, through Friday’s low, the US dollar index proceeded to drop 1.9 percent. Decent resistance lies at 97.50-98.
The index currently sits at the 50-day (96.08). Around 96 also lies a one-year rising trend line. Near term, there is room for the daily to continue to unwind overbought condition. Loss of 96 ensures a test of the 200-day (95.50).
VIX: Currently net short 89k, down 5.1k.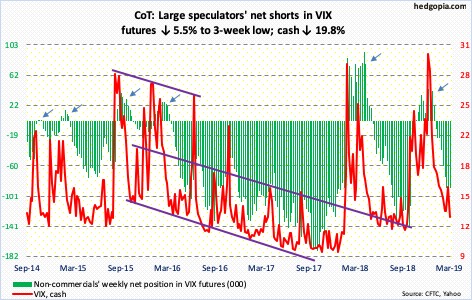
On Friday last week, the cash (12.88) rallied strongly intraday to 18.33 but only to get rejected near the 50-day. Through Friday’s low of 12.50, VIX fell nearly six points. Like that.
If there is any consolation for volatility bulls, it is that VIX currently sits near the lower Bollinger band, and that the daily is getting oversold. But a convincing loss of 13 opens the door to a test of the 11 handle.
In the meantime, after bottoming at 0.594 on March 1, the 21-day moving average of the CBOE equity-only put-to-call ratio continues to inch up, with Friday at 0.619. The ratio can rise toward high-0.60s/low-0.70s. When that happens, stocks in general go the other way.


