
CoT: Peek Into Future Through Futures, Hedge Funds Position
Following futures positions of non-commercials are as of November 23, 2021.
10-year note: Currently net short 323.4k, up 29.3k.
(Click on image to enlarge)
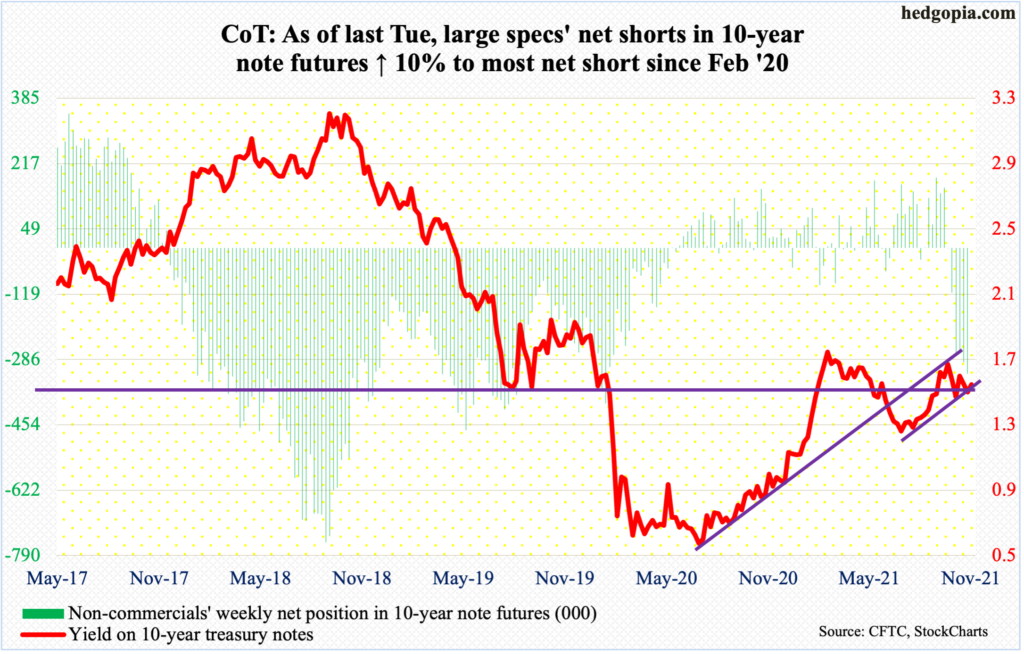
As of last Tuesday, non-commercials added more to their holdings of net shorts in 10-year note futures. They are now most net short since February last year. Directionally, their bearishness seemed appropriate as on Wednesday the 10-year treasury yield touched 1.69 percent, matching the intraday high from October 22. On both those occasions, bears (on price) were unable to hang on to the gains, with the 10-year closing at 1.65 percent last Wednesday. In the next session – that is, Friday – rates gapped down 17 basis points, as stocks tumbled across the board; the session low of 1.47 percent just about tested horizontal support at mid-1.40s. This was also a test of the 200-day (1.49 percent). It has held – thus far.
Yesterday, yields rose five basis points to 1.53 percent. On the daily, there is still room for rates to head lower. But if the bears regroup and bonds sell off more, Friday’s gap gets filled at 1.64 percent.
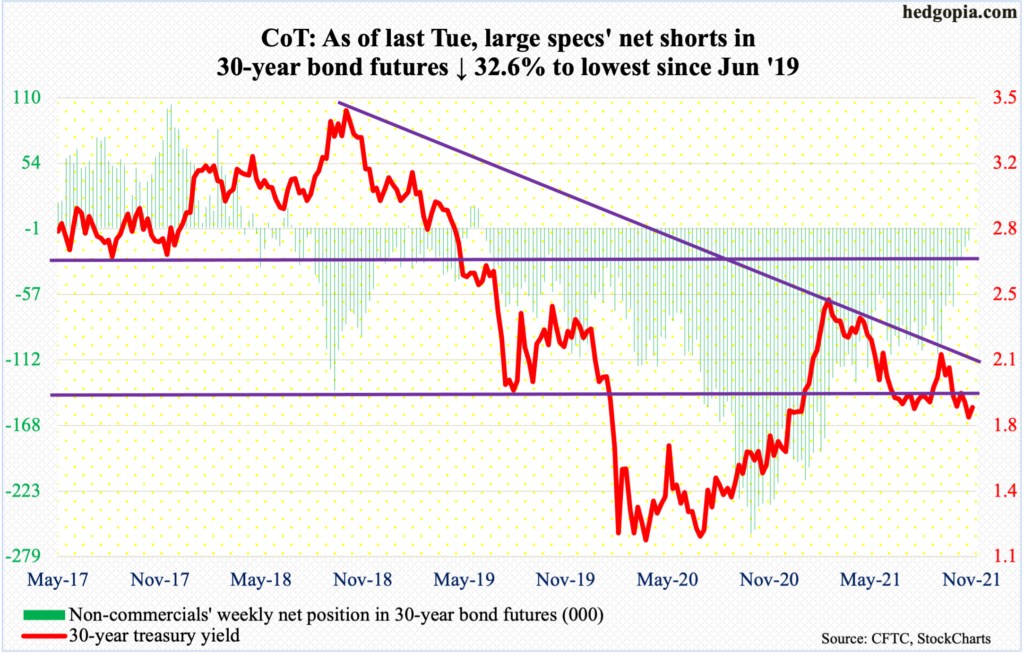
30-year bond: Currently net short 11k, down 5.3k.
(Click on image to enlarge)
Major economic releases for rest of the week are as follows.
The S&P Case-Shiller Home Price Index (September) is due out later this morning. Nationally, US home prices surged 19.8 percent month-over-month in August. This was the steepest price rise in the series’ nearly 47-year history.
Wednesday brings the ISM manufacturing index (November). Manufacturing activity in October dropped three-tenths of a point m/m to 60.8.
Nonfarm payrolls (November), the ISM non-manufacturing index (November) and durable goods orders (October, revised) will be published on Friday.
In October, the US economy added 531,000 non-farm jobs m/m to 148.3 million. Since the post-pandemic low of 130.2 million, 18.2 million jobs have been added. This is still 4.2 million short of the February 2020 high of 152.5 million.
October services activity jumped 4.8 points m/m to 66.7. This was the eighth consecutive 60-plus reading.
October’s preliminary reading showed orders for non-defense capital goods ex-aircraft – proxy for business capex plans – jumped 12.9 percent year-over-year to a seasonally adjusted annual rate of $78.6 billion, which is a new record.
WTI crude oil: Currently net long 440.3k, down 6.8k.
(Click on image to enlarge)
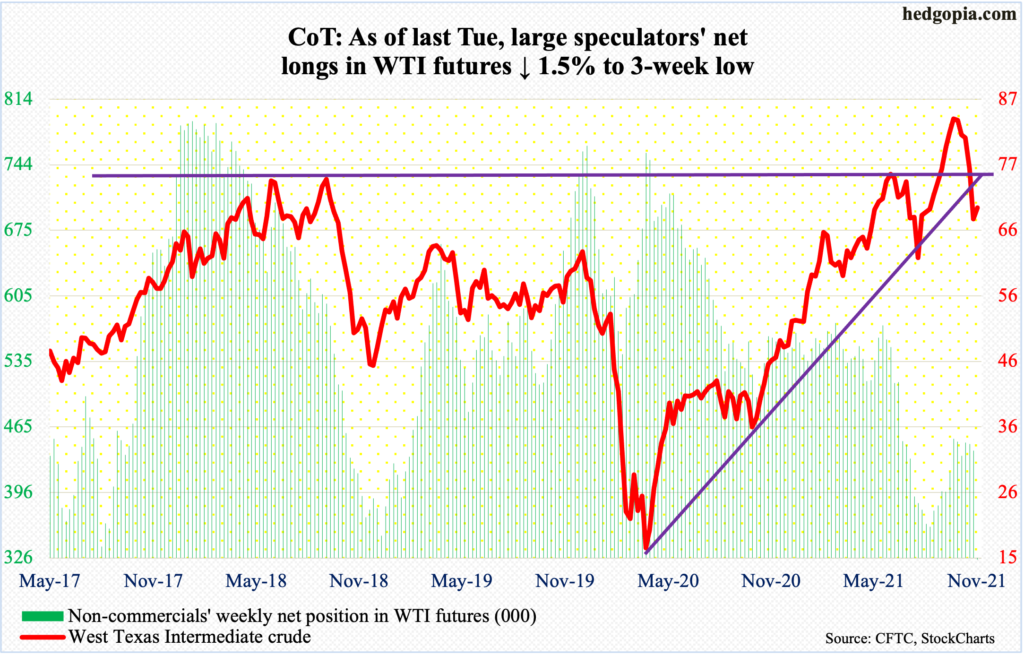
WTI ($69.95/barrel) collapsed 13.1 percent last Friday to lose the 200-day and close the week at $68.15, down 10.3 percent for the week and its fifth straight down week. Monday’s 2.6-percent rally helped it close right on the average. Friday’s tumble preceded a rejection on Tuesday and Wednesday at the 50-day. The average is now slightly turning down.
On October 25, the crude hit a seven-year-high $85.41 before losing steam. Last Friday’s mini-crash also sliced through horizontal support at $76-$77, which the crude broke out of in early October. Next comes straight-line support at $66-$67, which goes back at least 16 years and was hit intraday Friday.
Both the weekly and monthly have a ways to go before the overbought condition they are in gets unwound. In April last year, the crude languished at $6.50 (no typo), so it has come a long way. If $66-$67 holds, the daily can rally near term.
E-mini S&P 500: Currently net long 123.8k, up 12.7k.
(Click on image to enlarge)
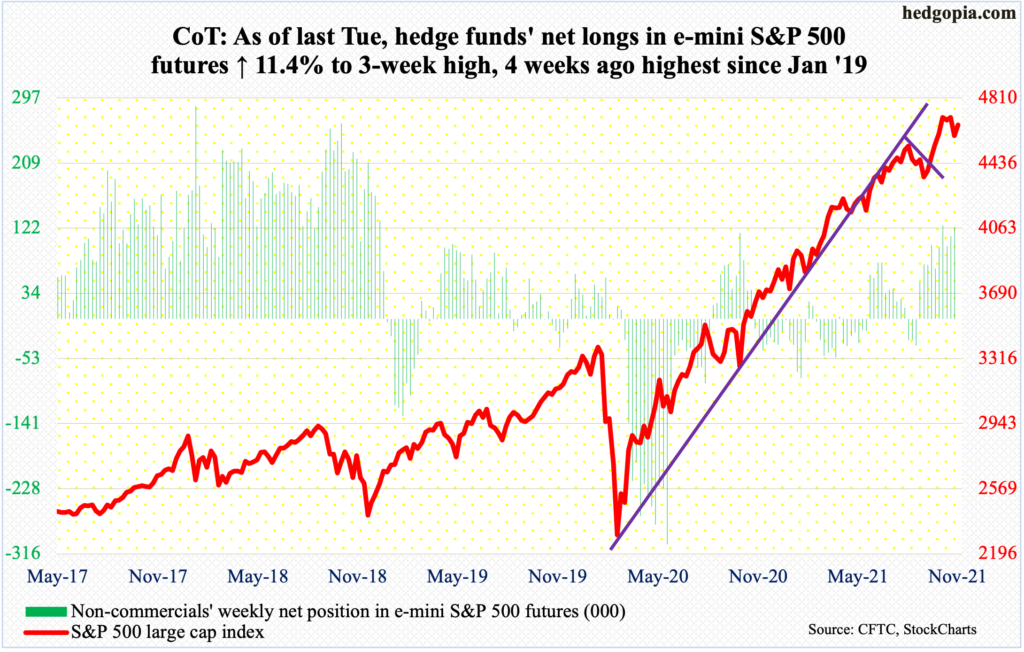
By the end of last week, November was on the verge of ending with a massive monthly shooting star, which is potentially bearish. This was preceded by a bearish outside month in September, which was immediately negated by October’s bullish outside month.
Monday’s 1.3-percent jump has changed the shape of the monthly candle, but there is one more session to go before the month was out.
Last Friday’s 2.3-percent tumble came after bulls defended the 10- and 20-day on Tuesday and Wednesday but had earlier failed to cash in on a potentially bullish ascending triangle. On November 5, the S&P 500 tagged 4719 intraday in a spinning top session. It then went sideways within a triangle, which it broke out of last Monday but only to reverse sharply lower.
There is horizontal support at 4540s, with the 50-day at 4532. The index closed Monday at 4655.
Euro: Currently net short 16.5k, up 12.6k.
(Click on image to enlarge)
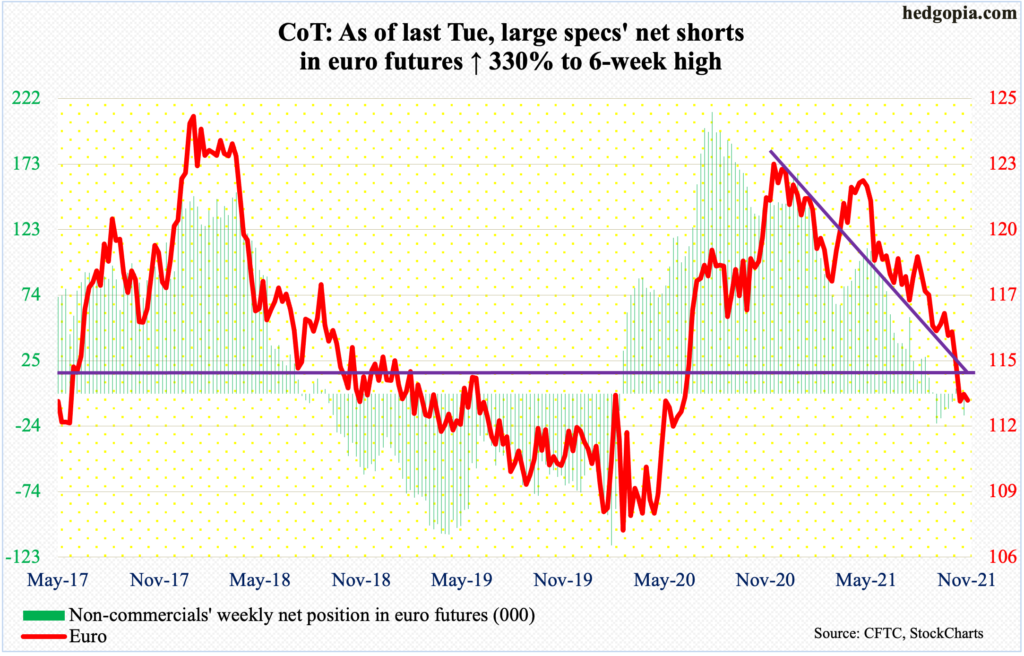
The euro ($1.1292) dropped as low as $1.1186 last Wednesday but Friday’s one-percent rally helped it hammer out a potentially bullish weekly hammer. In January this year, the currency peaked at $1.2345.
Support at $1.14-$1.15 goes back at least 18 years. This is where a bull-bear duel is likely to unfold in the near future.
Gold: Currently net long 234.4k, down 25.4k.
(Click on image to enlarge)
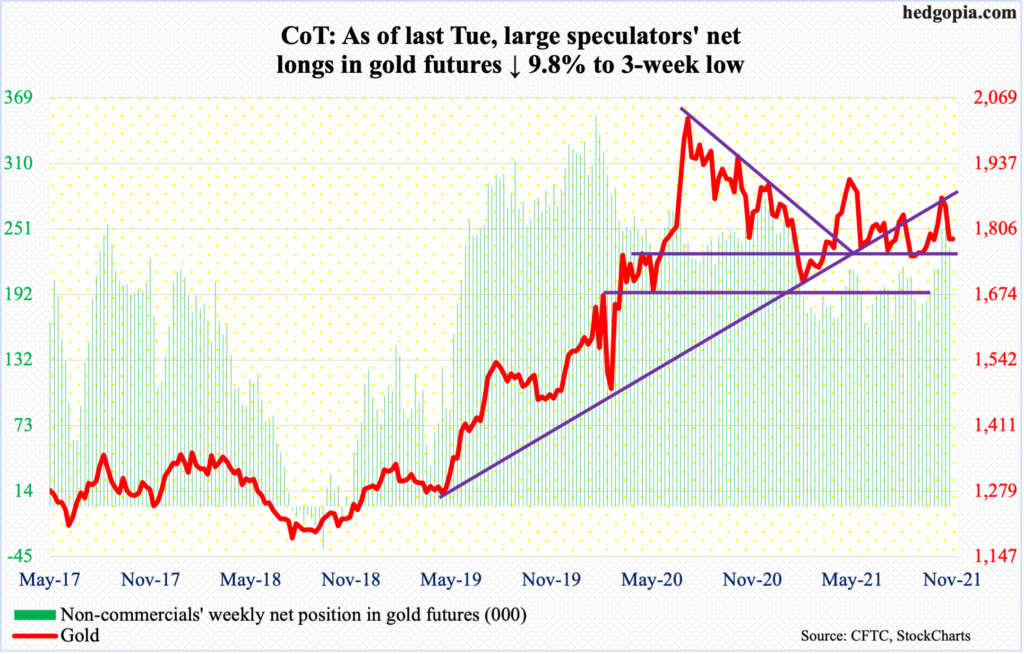
On August 9, gold ($1,785/ounce) bottomed at $1,670s. Last Friday’s low of $1,779 (as well as Wednesday’s $1,777 and Monday’s $1,782) essentially tested a rising trend line from that low. At $1,760s-$1,770s also lies horizontal support.
The metal recently – on November 16, to be precise – peaked at $1,880. The drop since has cost it the 50- and 200-day (respectively $1,791 and $1,792), although not by much.
As long as $1,760s-$1,770s remains intact, gold bugs deserve the benefit of the doubt.
Nasdaq 100 index (mini): Currently net long 28k, up 14.6k.
(Click on image to enlarge)
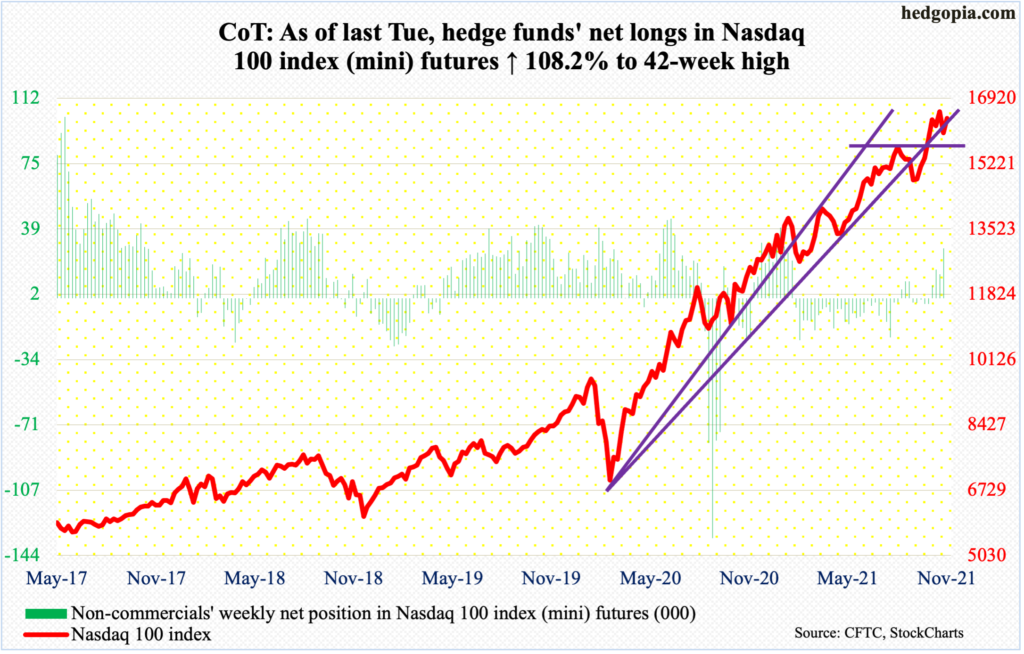
The Nasdaq 100 last week suffered an outside week, down 3.3 percent. Until last Friday, November was on course for a potentially bearish shooting star. After Monday’s 2.3-percent jump, the monthly candle does not look as ominous, but the month is not over yet.
On Monday last week, the tech-heavy index (16399) rallied strongly to post a new intraday high of 16765 but only to reverse strongly and end the session in the red. This was followed by Friday’s 2.1-percent rout.
Nearest support lies at 15700s.
Russell 2000 mini-index: Currently net short 21.5k, up 1.4k.
(Click on image to enlarge)
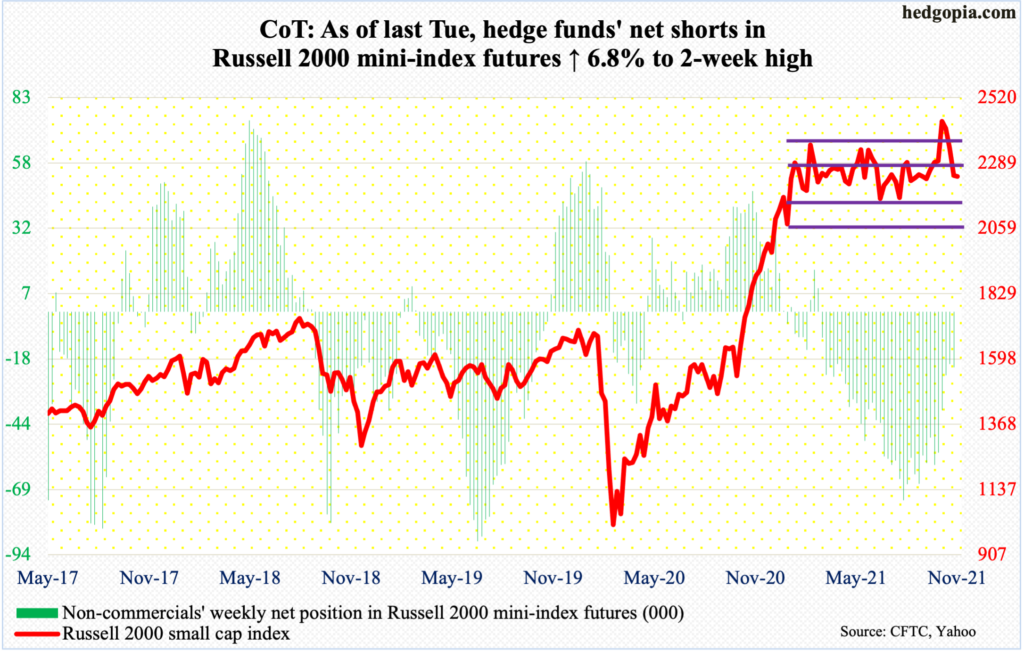
No sooner than the Russell 2000 staged a box breakout on the 3rd (this month) than a retest failed on the 19th. For nearly eight months, the small cap index was rangebound between 2350s and 2080s, and between 2280s and 2150s within this rectangle.
Before last week’s failed retest, the index rallied to 2459 on the 8th. If the breakout was genuine, using a measured move approach, technicians would in due course be eyeing 2600. Thus far, this has proven to be a failed breakout.
Last Friday’s 3.7-percent tumble also cost the Russell 2000 (2242) 2280s support. A decisive loss of 2250s should open the door toward 2150s, and 2080s in a worse-case scenario.
US Dollar Index: Currently net long 35.8k, up 867.
(Click on image to enlarge)
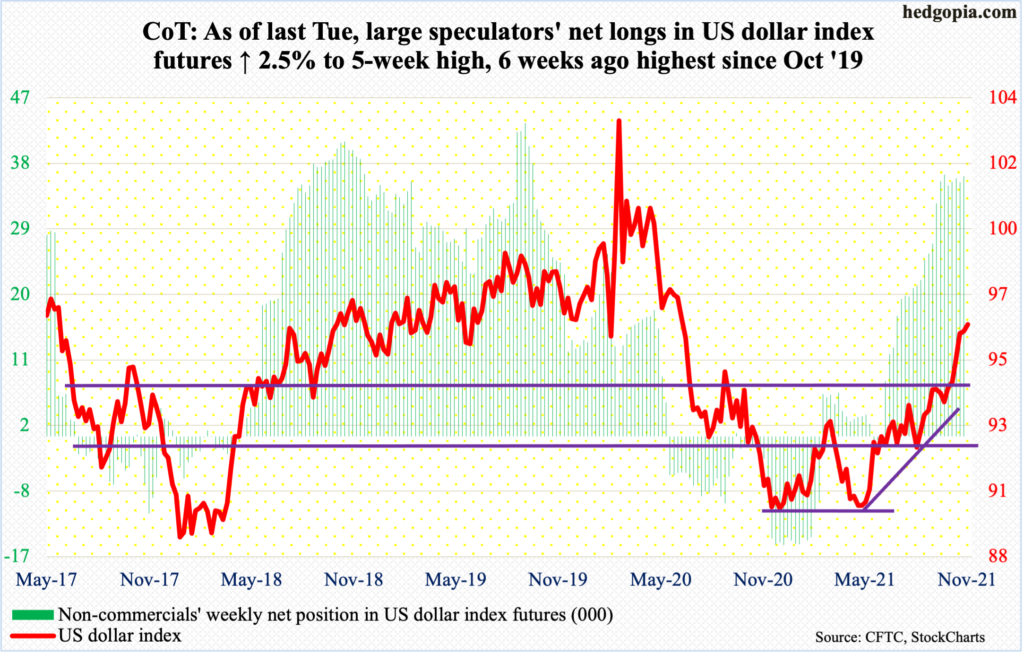
The US dollar index (96.34) last Wednesday tagged 96.94 intraday. As recently as November 10, it broke out of 94.50s, having earlier bottomed at 93.26 on October 28.
Dollar bulls were unable to hang on to last week’s high, ending with a weekly gravestone doji. Horizontal resistance around 97 also goes back at least 18 years.
Given the overbought condition it is in, the index’s path of least resistance is down. A rising trend line from May this year extends to just north of 94 and this should approach 94.50s soon. Hence, this is the one to watch for now.
VIX: Currently net short 81.9k, up 19.4k.
(Click on image to enlarge)
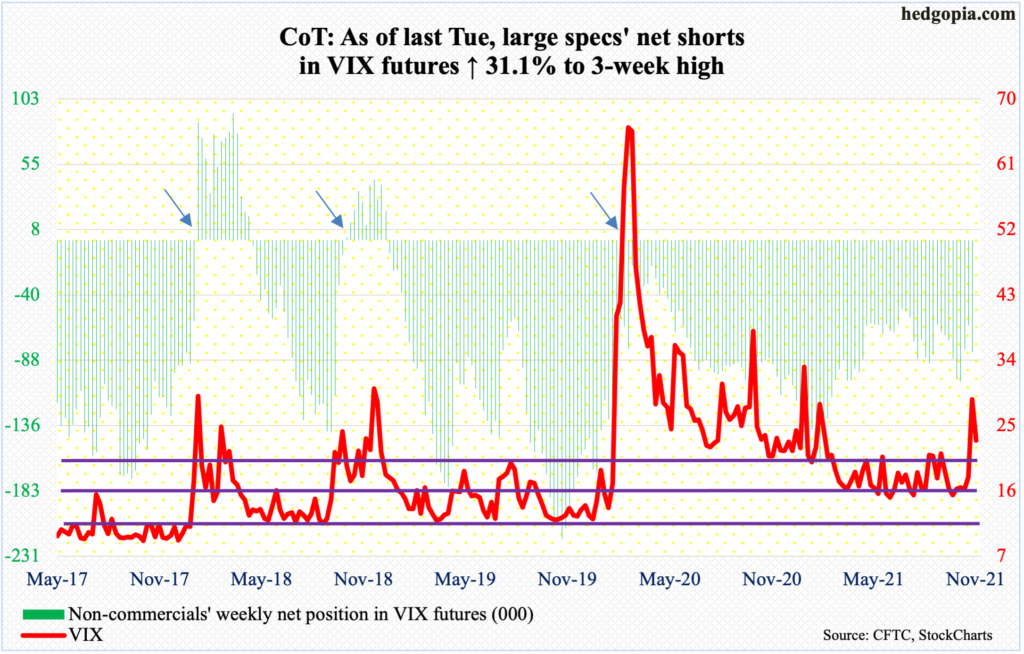
Volatility roared back to life last week, particularly on Friday when VIX shot up 10.04 points to 28.62, closing near the session high 28.99. Twice in the past six months, the index peaked at comparable levels – printing 28.93 in May and 28.79 in September. On both those occasions, the weekly candle ended in a long upper shadow. Not this time. Volatility bulls stayed put. On Monday, VIX shed 5.66 points to 22.96, but the week is young.


