
CoT: Peek Into Future Through Futures For The Week Ahead, February 9
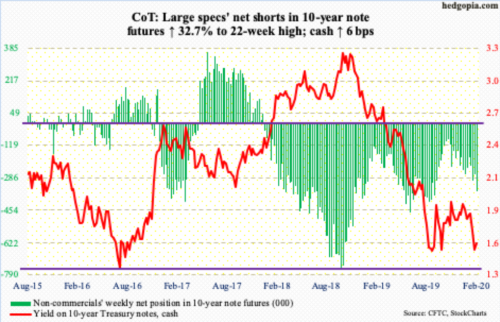
Following futures positions of non-commercials are as of February 4, 2020. 10-year note: Currently net short 358.9k, up 88.5k.
One more week of additional liquidity from the Fed!In the week to Wednesday, SOMA (System Open Market Account) holdings went up $18.8 billion to $3.79 trillion. Since the last week of September last year, they have gone up by $239.1 billion. Back then, these assets were $3.55 trillion, down from $4.24 trillion in April 2017. For reference, they were under $500 billion pre-2008/2009 financial crisis.
The Fed is growing its balance sheet at a time when the economy continues to grow and churn out jobs. January added 225,000 non-farm jobs.Imagine what shape the balance sheet will take when the economy begins to contract. As things stand, equities cherish an expanding balance sheet. This was repeatedly seen when the Fed carried out QE1/2/3.Most recently, stocks bottomed early October last year, coinciding with the bottom in SOMA holdings.
The Fed’s ability to print money knows no bounds, and stocks love liquidity. This is a nightmare scenario for bears – until the cycle reaches a point when the Fed continues to expand its balance sheet and stocks begin to go the other way. When such a time arrives, the 10-year Treasury yield (1.58 percent) probably will be a lot lower, well past the lows of both July 2012 and July 2016 – 1.39 percent and 1.34 percent, respectively. For now, rates face resistance at 1.67 percent and just under two percent after that.
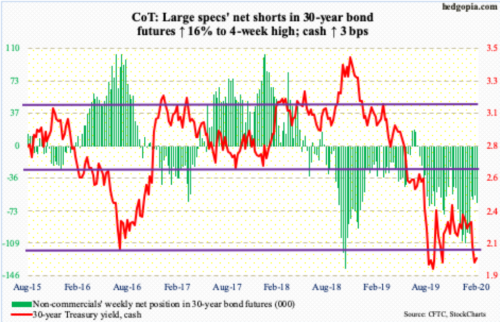
30-year bond Currently net short 63.8k, up 8.8k.
:
Major economic releases next week are as follows:
NFIB job openings (January) and JOLTS job openings (December) are on tap Tuesday.
In December, small-business job openings fell five points month-over-month to 33. Between December 2018 and July 2019, record 39 was hit three times.
Non-farm job openings in November dropped 561,000 to seasonally adjusted 6.8 million.The all-time high of 7.63 million was reached in November 2018.
The CPI (January) will be published Thursday. In December, consumer prices and core CPI respectively edged up 0.2 percent and 0.1 percent m/m.In the 12 months to December, they both rose 2.3 percent.
Friday brings retail sales (January), industrial production (January) and the University of Michigan’s consumer sentiment index (February).
December capacity utilization declined 3.1 percent year-over-year to 77 percent. This was the ninth consecutive y/y decline.The cycle high 79.6 percent was set in November 2018 – peaking before reaching 80 percent.
In the 12 months to December, retail sales jumped 5.8 percent to a seasonally adjusted annual rate of $529.6 billion. This was the highest y/y growth rate since August 2018 when sales expanded 6.1 percent.
January consumer sentiment rose five-tenths of a point m/m to 99.8.Except for last August’s 89.8, sentiment has remained north of 90 since November 2016, four of them 100 or higher.
WTI crude oil: Currently net long 607.8k, down 46.8k.
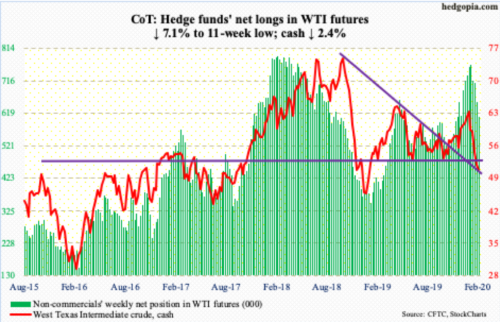
The downward momentum since the cash ($50.32/barrel) peaked at $65.65 intraday on January 8 is trying to stabilize, but bulls have their work cut out.Tuesday, the crude made a low of $49.31, past $50-51 support, which bulls defended several times between June and September last year. Wednesday and Thursday, some bids appeared.
The EIA report for the week of January 31 helped.Refinery utilization inched up two-tenths of a percentage point to 87.4 percent.Distillate and gasoline stocks fell – by 1.5 million barrels and 91,000 barrels respectively to 143.2 million barrels and 261.1 million barrels. Crude imports dropped 45,000 barrels per day to 6.6 million b/d. After three weeks at record 13 mbpd, crude production fell 100,000 b/d to 12.9 mb/d.Crude stocks, however, rose 3.4 million barrels to 435 million barrels.
The daily remains grossly oversold. But $50-51 needs to hold.Shorter-term moving averages are still dropping, and they need to stabilize.For that, sideways action will help. It will also help if Russia agrees to OPEC recommendation of deep production cuts in response to the coronavirus outbreak.It says it needs more time to decide.
E-mini S&P 500: Currently net long 46.1k, up 29.4k.
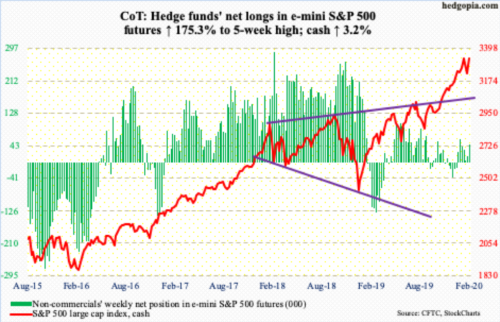
Since the cash (3327.71) peaked at an intraday high of 3337.77 on January 22 through last Friday’s low of 3214.68, it quickly dropped 3.7 percent, even falling out of an ascending channel from early October last year. This was a small victory for bears, but they were unable to also take control of the 50-day moving average (3230.88), which has not been lost for nearly four months. This week, the S&P 500 quickly rallied back into the channel, printing a new high of 3347.96. Flows improved leading up to that.
In the week to Wednesday, US-based equity funds gained $3.4 billion (courtesy of Lipper).In the same week, SPY (SPDR S&P 500 ETF), VOO (Vanguard S&P 500 ETF) and IVV (iShares Core S&P 500 ETF) together took in $10.7 billion (courtesy of ETF.com).
Immediately ahead, 3330s hold the key.Bears can get active here.They managed to end January slightly down, but February-to-date is up 3.2 percent.
Euro: Currently net short 75.1, up 16.2k.
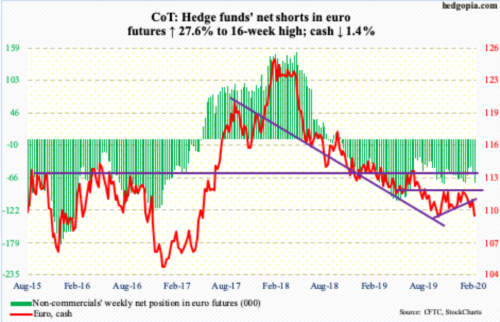
The weekly RSI has not exceeded low 50s for nearly two years now. Last week, it again turned lower from the median.This week, the cash ($109.46) shed 1.4 percent.
Two weeks ago, a rising trend line from early October last year was breached. Last Friday, bulls reclaimed that level, but only to then get denied at the 50-day last Friday. This Thursday, the euro lost straight-line support just under $110. The October 1st low of $108.85 has now become relevant.
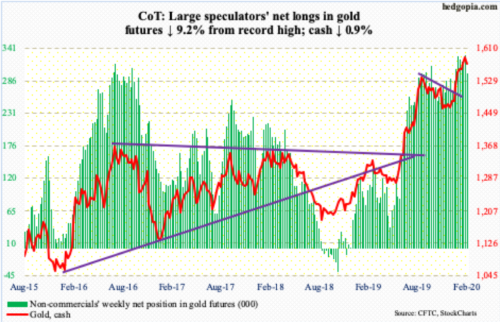
Gold: Currently net long 299.8k, down 30.3k.
In the week to Wednesday, $26 million came out of IAU (iShares Gold Trust), even as GLD (SPDR Gold ETF) took in $594 million (courtesy of ETF.com). In the prior two, the latter gained $1.3 billion.
The cash ($1,573.40/ounce) remains above resistance-turned-support at $1,550s-60s, which right here and now is increasingly a make-or-break.
On January 8, gold reversed hard after printing $1,613.30 intraday. Again, this Monday, the metal posted $1,598.50 intraday before reversing. But the afore-mentioned support was defended in the last four sessions of the week. As long as the metal remains above this level, gold bugs deserve the benefit of the doubt. Otherwise, sentiment is too bullish, with non-commercials owning record net longs in gold futures in the prior week; this week, they cut back some.
Nasdaq 100 index (mini): Currently net long 21.3k, down 3.1k.
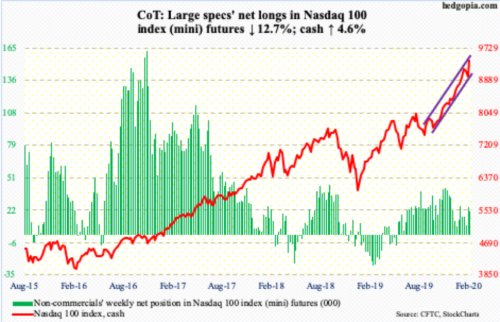
Negating the prior two weekly bearish-leaning candles, the cash (9401.10) this week shot up 4.6 percent this week.
In the week to Wednesday, QQQ (Invesco QQQ Trust) gained $275 million (courtesy of ETF.com).
Earlier, last Friday, the Nasdaq 100 closed right on channel support from the lows of last October. This week, the index rallied in the first four sessions, to a new intraday high of 9453.24. Importantly, it is now testing the upper end of the channel, which is an opportunity for bears. The first layer of support lies around 9300, which is a stone’s throw away. After that lie shorter-term moving averages between 9150s and 9200.
Russell 2000 mini-index: Currently net long 53.4k, down 4.9k.
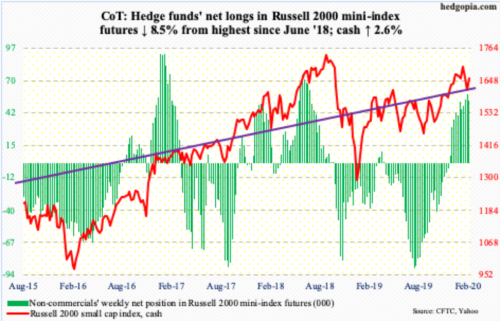
Last Friday, the cash (1656.78) closed right on two-year crucial support. Previously, the Russell 2000 retreated after printing 1715.08 on January 17. By Friday, it had dropped to 1610.64 intraday, closing at 1614.06.Small-cap bulls put their foot down where they needed to. The index rallied strongly the first three sessions this week, before struggling at short-term horizontal resistance at 1680s.This was an opportunity for bears to regroup and they have done so.
In the week to Wednesday, both IWM (iShares Russell 2000 ETF) and IJR (iShares Core S&P Small-Cap ETF) saw outflows – $1.1 billion and $33 million respectively (courtesy of ETF.com).In the prior three weeks, $2.6 billion came out of IWM.
US Dollar Index: Currently net long 17.1k, up 700.
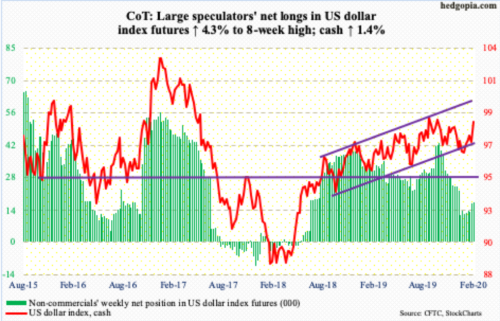
The trend-line support from September 2018 at 96.70s was never tested. Bids showed up this week well above that level. Last Friday, the 50-day was slightly breached. Monday, the cash (98.57) reclaimed the average as well as the 200-day. By Tuesday, it broke through a falling trend line from early October last year, proceeding to form a weekly white marubozu. Bulls are now probably eyeing 99.30s, which was tagged twice within a month between September and October last year.
VIX: Currently net short 117.2k, down 21.5k.
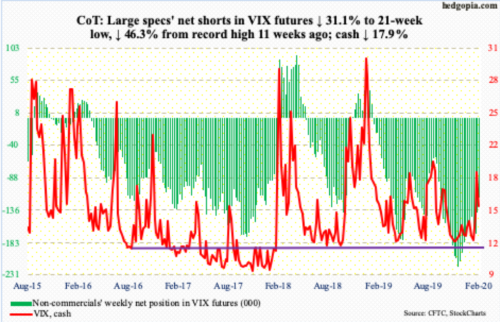
Same old, same old.The inability of volatility bulls to steadily build on whatever momentum they are able to garner once again became evident this week.Last week, the cash (15.47) finally broke through a falling trend line from last August when it peaked at 24.81. Turns out last Friday’s intraday high of 19.99 was a spike reversal. VIX lost 3.37 points this week.The 200-day (15.13) was lost Thursday, but reclaimed Friday. From volatility bulls’ perspective, this needs to hold. Worse, the 50-day lies at 13.94.
Thanks for reading!


