
CoT: How Hedge Funds Are Positioned This Week
Following futures positions of non-commercials are as of November 24, 2020 (data published this Monday instead of last Friday due to Thanksgiving holiday).
10-year note: Currently net long 115k, down 37.3k (SPTL).
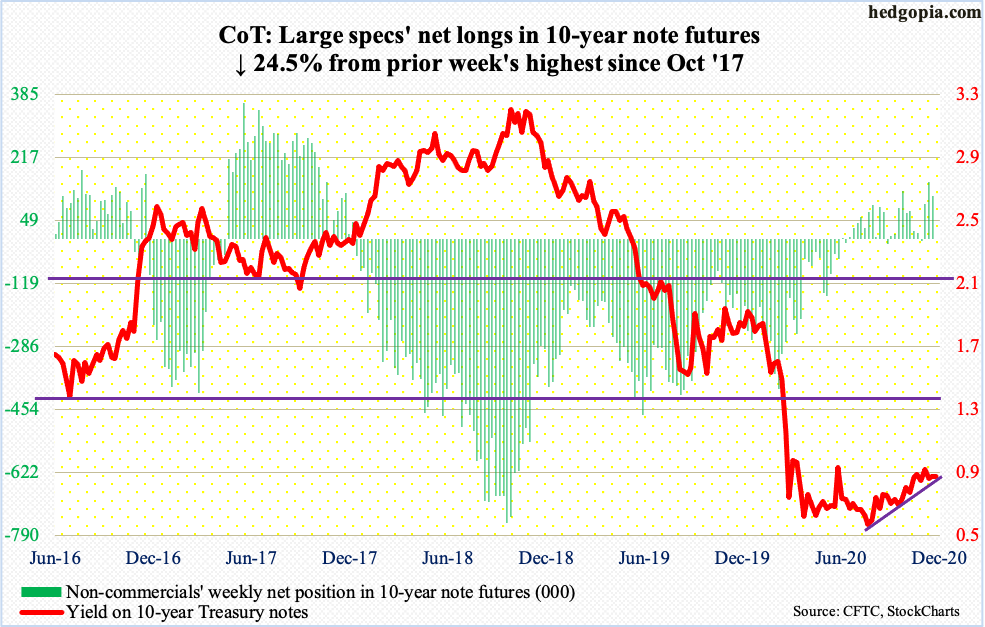
The 10-year Treasury yield (0.84 percent) has come under pressure since peaking at 0.98 percent on November 9. That was the day Pfizer (PFE) announced its positive vaccine news, which significantly raised investor hopes that the US economy would begin to get back to normal next year. One would think this would put yields under upward pressure. But they retreated from an important spot.
The last time these notes yielded one percent was on March 20 this year. Since then, bond bears (on price) came close to achieving that feat a few times, including 0.96 percent on June 5 and the aforementioned 0.98 percent. Close, but no cigar.
Yields are approaching important support, where these bears can try to regroup. A rising trend line from early August draws to 0.81 percent. Right underneath lies the 50-day moving average at 0.80 percent. If indeed the collective wisdom of markets expects the economy to heat up next year, this support likely gets used as an opportunity to go short.
As of last Tuesday, non-commercials, however, reduced their net shorts in 10-year note futures by 24.5 percent.
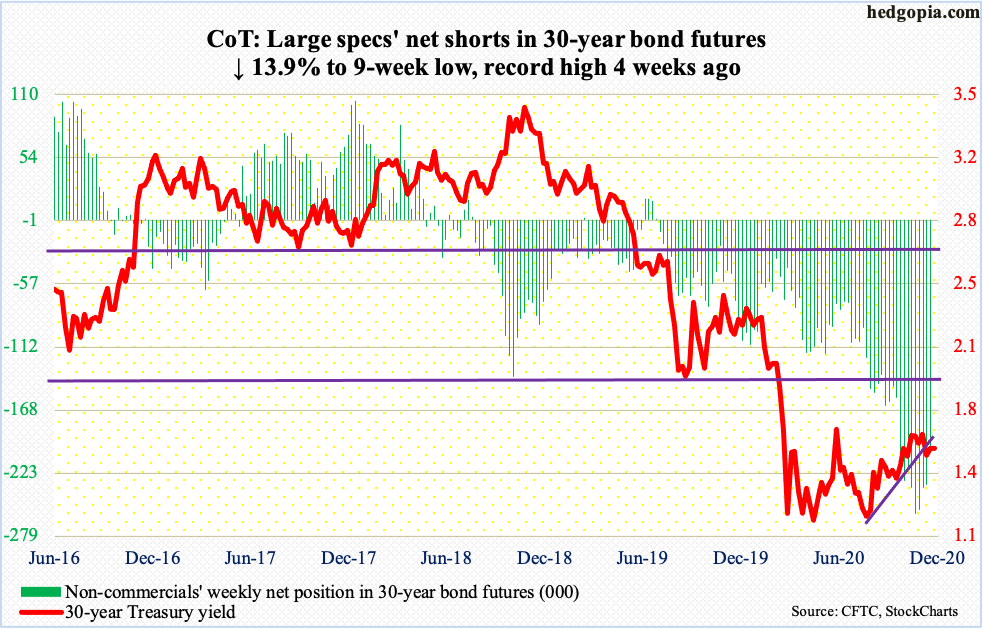
30-year bond: Currently net short 201.9k, down 32.5k (TYX).
Major economic releases for the rest of the week are as follows.
Later this morning, the ISM manufacturing index (November) comes out. Manufacturing activity in September rose 3.9 points month-over-month to 59.3, matching the high from September 2018.
Thursday brings the ISM non-manufacturing index. In September, services activity dropped 1.2 points m/m to 56.6 – a five-month low.
Employment data (November), durable goods orders (October, revised) and labor productivity (3Q20, revised) are due out Friday.
Between February and April, non-farm payroll contracted by 22.2 million, to 130.3 million. Between that low and October, 12.1 million jobs were created, meaning there are 10.1 million fewer jobs from the pre-pandemic record high.
Preliminarily in October, orders for non-defense capital goods ex-aircraft – proxy for business capex plans – increased 6.2 percent to a seasonally adjusted annual rate of $70 billion – a new high. In April, orders were down to $61.3 billion.
Preliminarily, non-farm output/hour rose at an annual rate of 4.9 percent in 3Q20. This was the fastest pace since 4Q09.
WTI crude oil: Currently net long 562k, up 28.6k.
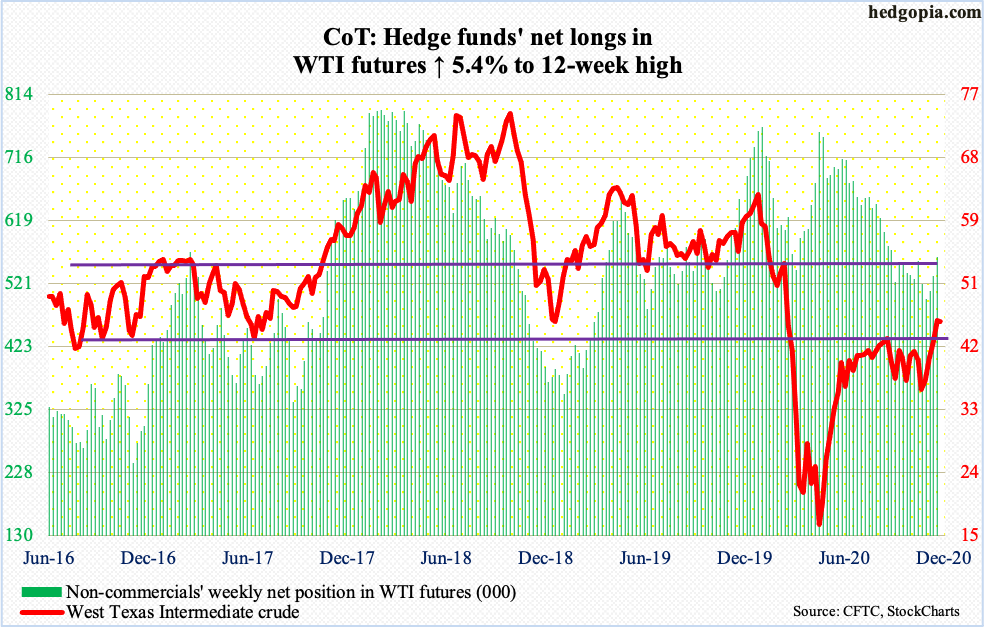
Amidst signs of disunity, OPEC+ met yesterday. There was no agreement on the production cuts next year. They will sit down again on December 3. Of the major players, Saudi Arabia reportedly is in favor of an extension of the current production cuts. Russia, on the other hand, wants to gradually increase production.
Ahead of this, WTI ($45.34/barrel) jumped $3.11 last week, past crucial horizontal resistance at $42-$43, which drew sellers for over four months. Last Wednesday, the crude rallied as high as $46.26, although the session produced a candle with a fairly long upper shadow. This was then followed by a potential hanging man last Friday and a long-legged doji yesterday.
The daily is extended. A retest of $42-$43 likely lies ahead (BNO).
E-mini S&P 500: Currently net short 13.4k, up 52.2k.
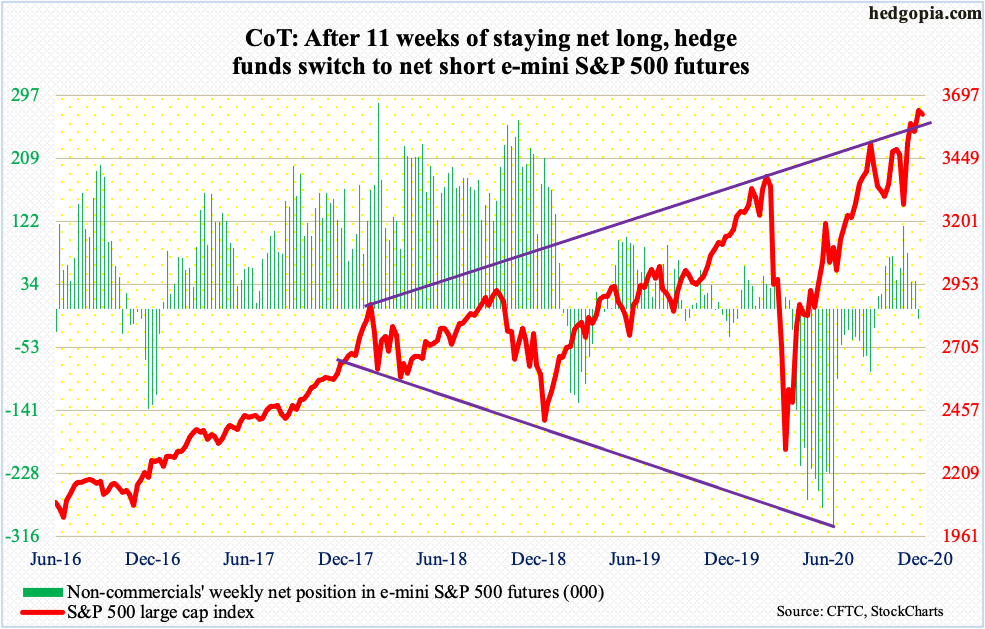
The November 9th intraday record high of 3645.99 stands. Post-Pfizer news, the S&P 500 (3621.63) gapped up but only to give back most of its gains to close at 3550.50 for a shooting star session. Since then, there has been other vaccine-related news, like that from Moderna (MRNA) a week after that, and the S&P 500 has essentially gone sideways, with a couple of long-legged dojis and a doji.
Last week, bulls were denied at 3640s. Yesterday, they defended the 10-day as well as 3580s. With the daily as overbought as it is, bears likely will continue to hammer on this in the sessions ahead. Odds favor they will succeed in reclaiming the levels. As of last Tuesday, non-commercials switched to net short e-mini S&P 500 futures.
Euro: Currently net long 138.3k, up 4.3k (FXE).
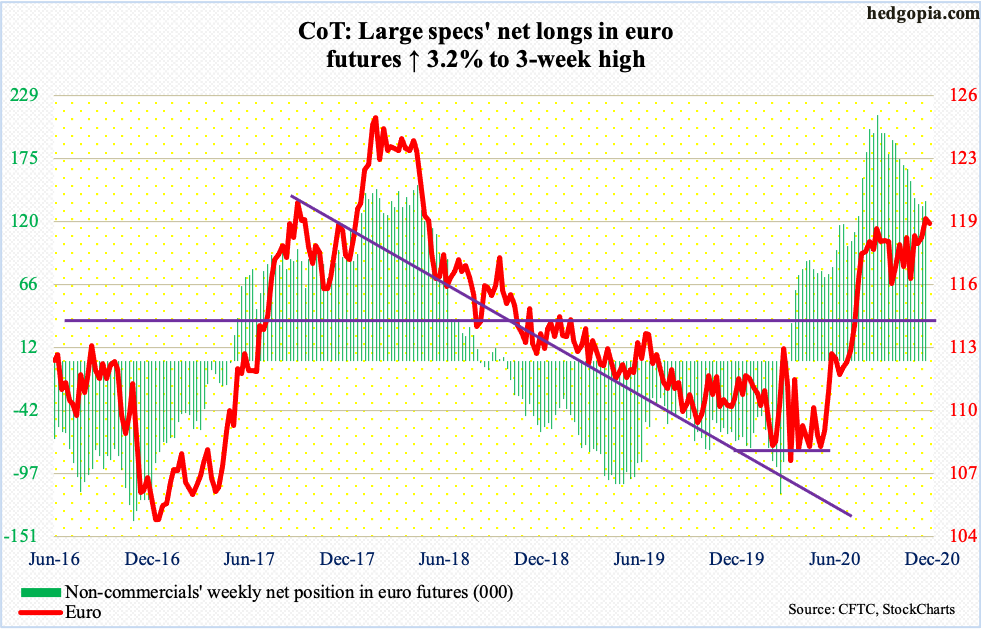
From the intraday low of $1.1799 just above the 50-day on Monday to Friday’s close of $1.1958, the euro finished last week with a weekly hammer. This formed right at major resistance at $1.19-$1.20. This ceiling goes back to May 2003. Euro bulls have been hammering on this for four months now. A breakout will be massive.
Yesterday, the currency tagged $1.2004 intraday before reversing to end the session at $1.1932. Bulls’ mettle is being tested even as the daily remains extended. Immediately ahead, support lies at $1.19.
Gold: Currently net long 243.9k, down 7.4k (GLD).
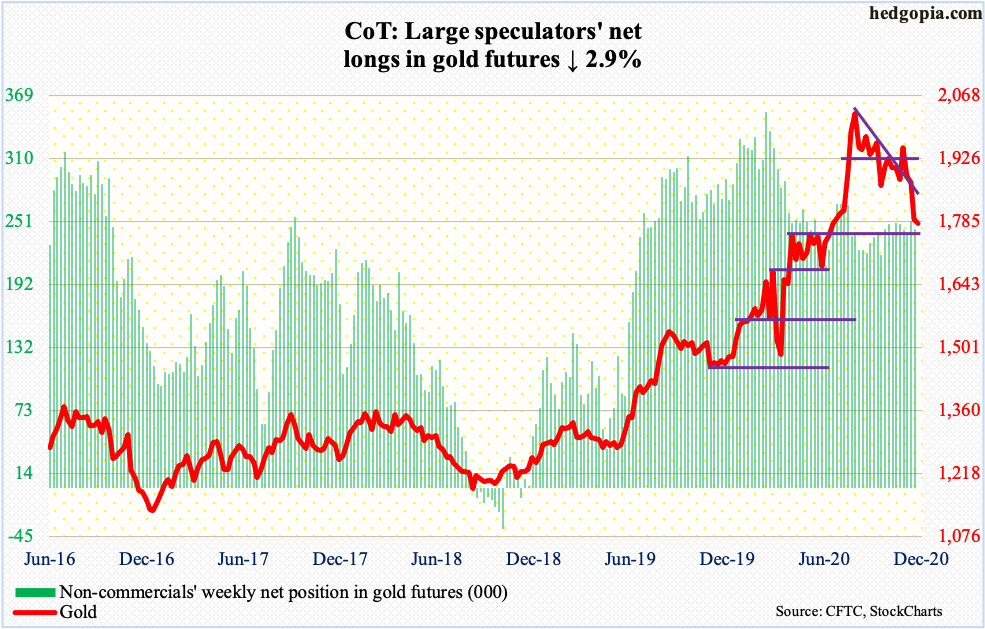
Gold ($1,780.90/ounce) started last week with a breach of $1,850s. By Friday, it sliced through the 200-day.
The metal peaked at $2,089.20 on August 7, with a streak of lower highs since. Particularly on the 9th, the day the Pfizer news came out, gold strongly reversed lower, slicing through its 50-day and closing down five percent to $1,850s. That support is now gone. There is horizontal support at $1,750s, which was just about tested yesterday. Since the August high, bulls have struggled to save one after another support. They are once again being tested.
Nasdaq 100 index (mini): Currently net short 22.8k, up 6.3k.
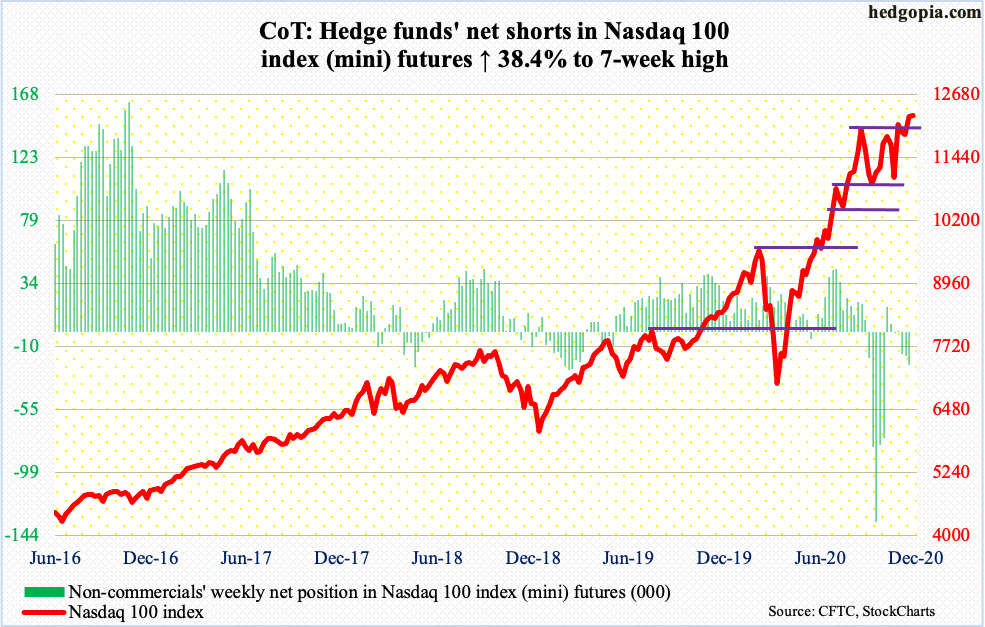
On September 2 when the Nasdaq 100 (12668.32) reached an intraday high of 12439.48, a potentially bearish hanging man formed. Since that high, the index has essentially gone sideways. Rally attempts have repeatedly been denied at 12200-12300 (NDX).
Yesterday, bids showed up just above the 10-day for an essentially flat session, but once again a hanging man formed. To recall, on the 9th when the Pfizer news came out, the Nasdaq 100 reversed lower to end the bearish engulfing session in the red.
As things stand, tech in recent weeks has been a source of funds.
Russell 2000 mini-index: Currently net long 46.7k, up 4.9k.
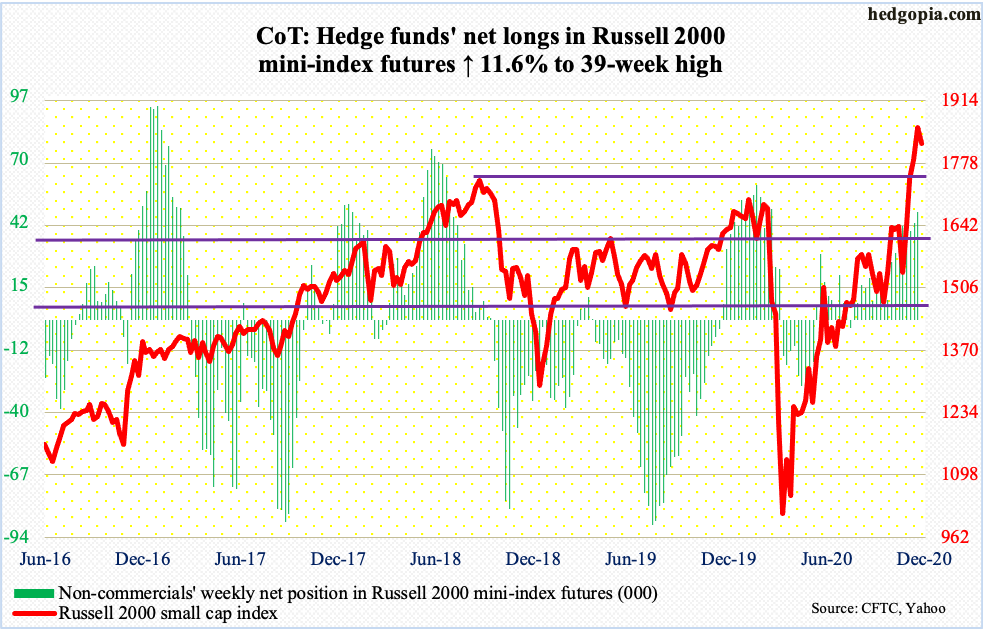
Since the November 3rd presidential election and the Pfizer news in particular, small-caps have been a go-to sector. Last month, it jumped 18.3 percent, versus 10.8 percent for the S&P 500 and 11 percent for the Nasdaq 100.
Along the way, the Russell 2000 (IWM) registered important breakouts – first 1600-plus and then 1740s. The latter represents the prior high from August 2018. At least measured by small-cap performance, there is increasing willingness to take on risk.
The Russell 2000 also has stronger correlation with FINRA margin debt versus the S&P 500 and the Nasdaq 100 (more on this here). In October, margin debt was less than $10 billion from its May 2018 high. It is likely November made a new high in margin debt.
Non-commercials continued to add to their net longs in Russell 2000 mini-index futures, which are now at a 39-week high. If past is prelude, it does not take long before these traders’ bullishness gets dangerously lopsided.
US Dollar Index: Currently net short 2.8k, up 1.8k.
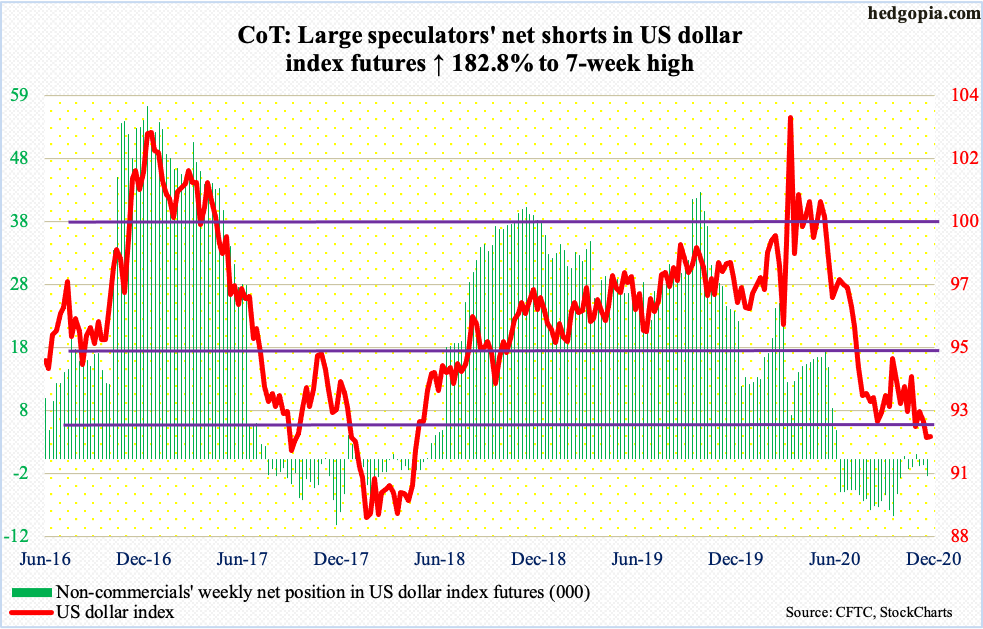
The US dollar index is flirting with a loss of major support. Going all the way back to June 2003, horizontal support at 92 has proven crucial. Dollar bears have tried to break this floor for four months now. Last Friday, it gave way. This was exacerbated yesterday as the index dropped to 91.49 intraday but only for bulls to claw their way back to close at 91.86, with the session producing a spinning top.
The daily is severely oversold, so a relief is due. Immediately ahead, bears likely will try to defend the 10-day (92.24).
VIX: Currently net short 86.6k, down 549.
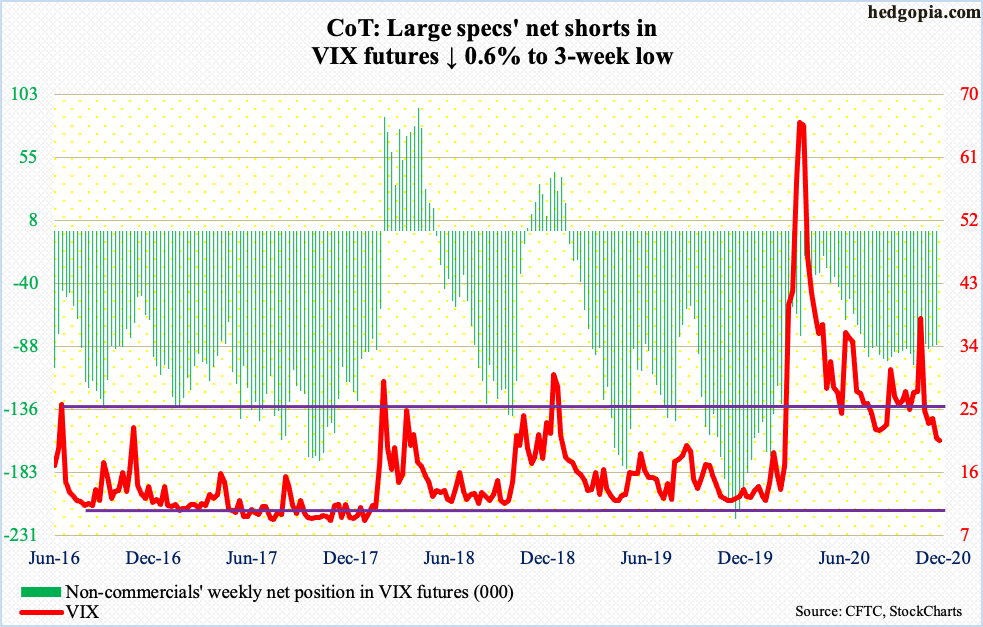
For the first time since February 21, VIX (20.57) went sub-20 last Friday, printing 19.51 (VIX). Yesterday, as the S&P 500 came under pressure, volatility bulls tried to reclaim the 10-day intraday but failed – once again. The daily is extremely oversold, but until the average at least begins to flatten out, rally attempts will remain just that – attempts.
Thanks for reading!


