
CoT, Hedge Fund Positions As Of Midweek
Following futures positions of non-commercials are as of April 2, 2019.
10-year note: Currently net short 224.2k, up 57.7k.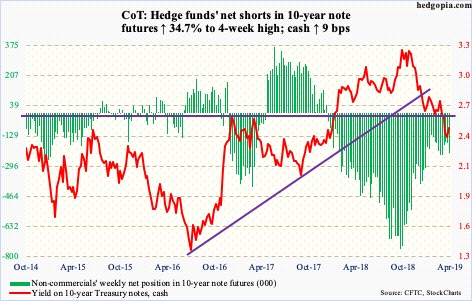
The 10-year Treasury rate (2.5 percent) rallied nine basis points this week. Support around the intraday low of 2.36 percent eight sessions goes back eight-plus years. In the right circumstances, the path of least resistance is 2.62 percent – a crucial level going back a decade – which was lost in the middle of March. The 50-day moving average lies right there.
That said, on several daily momentum indicators, the 10-year has reached the median. This is where bond bulls can step up and put their foot down. On Friday, when March’s jobs report came out, a mini-reversal indeed took place, with yields having touched 2.54 percent earlier in the session. TLT (iShares 20+ year Treasury bond ETF) peaked seven sessions ago at $126.69, closing Friday at $124.03. Near term, should $122.50s be tested, bond bulls likely spring into action.
30-year bond: Currently net short 19k, up 1k.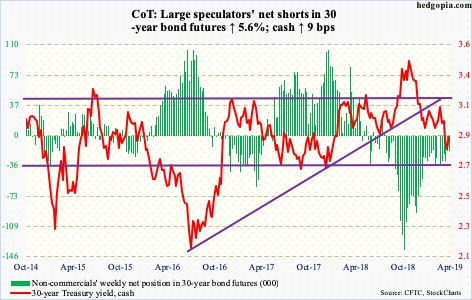
Major economic releases next week are as follows.
Revised durable goods data for February is due out Monday. Preliminarily, orders for non-defense capital goods ex-aircraft – proxy for business capex plans – rose 2.6 percent year-over-year to a seasonally adjusted annual rate of $68.9 billion. Last July’s $69.9 billion was the highest since March ‘12.
The NFIB small business optimism index (March) and JOLTS (February) are due out Tuesday.
Small-business job openings rose two points month-over-month in February to 37, two away from last December’s record 39.
In January, non-farm job openings increased 102,000 m/m to 7.58 million, within striking distance of last November’s record 7.63 million.
March’s CPI and FOMC minutes for the March 19-20 meeting come out Wednesday.
In the 12 months to February, core CPI rose 2.1 percent. This was the 12th consecutive two-plus reading, but at the same time inflation has softened since last July’s 2.35 percent.
The Fed kept the fed funds rate unchanged at 225-250 basis points in the March meeting. The last hike was last December. The Fed has already said there would be no hikes this year.
Thursday brings the PPI for March. February’s core wholesale prices increased 2.5 percent from a year earlier.
The University of Michigan’s consumer sentiment index for April is on tap Friday. March sentiment jumped 4.6 points m/m to 98.4 – a five-month high. The 101.4 reading in March last year was the highest since January 2004.
Crude oil: Currently net long 573.6k, up 18.4k.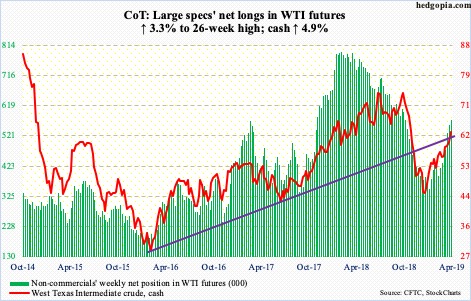
Friday’s intraday high of $63.26 kissed the underside of a trend line from February 2016 when the cash bottomed at $26.05. This resistance is being tested even as the crude ($63.08/barrel) is now way extended particularly on the daily and weekly. That high was hit just above the 200-day ($61.68) and right at the daily upper Bollinger band. Nearest support lies at $60.50s. Right around there rests trend-line support from late December last year. It is a line in the sand for near-term momentum.
The EIA report was mixed. For the week ended March 29, US crude production rose 100,000 barrels per day to 12.2 million bpd – a new record. Crude stocks increased 7.2 million barrels to 449.5 million barrels, and crude imports 223,000 bpd to 6.8 mbpd. Stocks of both gasoline and distillates, however, fell 1.8 million barrels and two million barrels respectively to 236.8 million barrels and 128.2 million barrels. Refinery utilization inched down two-tenths of a percentage point to 86.4 percent.
E-mini S&P 500: Currently net long 11.3k, down 12.8k.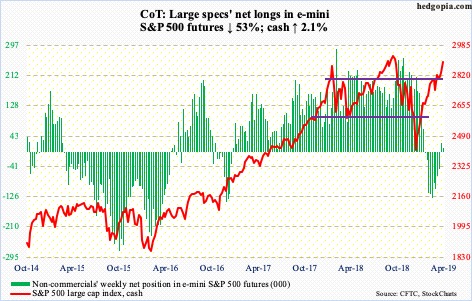
A golden cross (50/200) completed on Monday. From momentum’s standpoint, this is considered a bullish development. Although the fact remains that this has formed after the cash (2892.74) rallied 23 percent from post-Christmas lows. All along, sellers have been on strike, hence the low-volume push higher.
The S&P 500 large cap index is comfortably past crucial resistance north of 2800, but even here it never punched through that ceiling. The same usual trudge higher. The index rallied 2.1 percent this week, but two of the five sessions were dojis. The daily, as well as the weekly, is extended, although conditions have remained that way for a while.
Bulls are staying put in expectation of a favorable trade deal between the US and China, among others. Beginning next week, 1Q19 earnings season begins, and the hurdle is low. Given the massive rally into these events, it is too soon to say if this ends up being a ‘sell the news’ phenomenon, but it is prudent to remain open for that eventuality.
In the week through Wednesday, following outflows of $11 billion in the prior week, another $3.9 billion came out of US-based equity funds (courtesy of Lipper). In the same week, SPY (SPDR S&P 500 ETF), VOO (Vanguard S&P 500 ETF) and IVV (iShares core S&P 500 ETF), pulled in a combined $4.3 billion, versus loss of $2.7 billion in the prior week (courtesy of ETF.com).
Euro: Currently net short 99.2k, up 18.9k.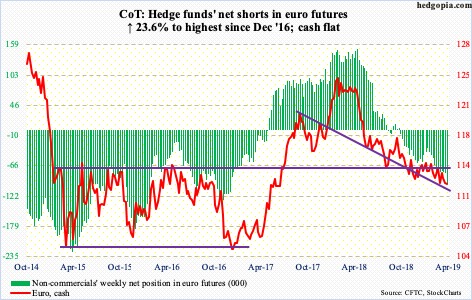
Factory orders in Germany fell 4.2 percent m/m and 8.4 percent y/y in February. This was the worst monthly fall in two years. The report came out Thursday. The cash ($112.21) fell 0.1 percent in that session but was down as much as 0.3 percent at one time. The low was bought. That was also the case Tuesday when the currency went sub-$112 intraday only to end the session with a long-legged doji. It increasingly fells like the euro is trying to bottom – at least near term. Decisive loss of $112, however, changes this.
Gold: Currently net long 94.6k, down 25.4k.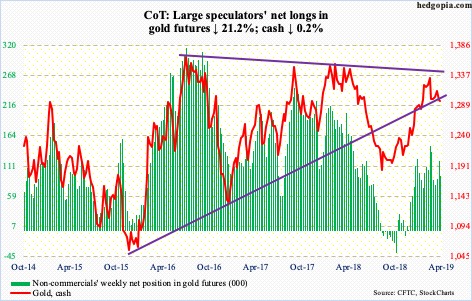
In a long-legged doji session Thursday, gold bugs stepped up to defend horizontal support at $1,280s near the daily lower Bollinger band. This was followed by a hammer Friday. Near-term, the cash ($1,295.60/ounce) has a shot at $1,300 or the 50-day at $1,309.42.
The weekly is in the midst of unwinding the overbought condition it is in. Failure to hold $1,280s raises the odds that this continues. A potentially bearish cross-under just formed on the weekly MACD.
Perhaps in anticipation of this, $831 million was withdrawn from GLD (SPDR gold ETF) in the week to Wednesday. This more than eclipsed the $752 million in inflows in the prior three weeks (courtesy of ETF.com). IAU (iShares gold trust) took in $21 million in the week to Wednesday.
Nasdaq 100 index (mini): Currently net long 7.1k, down 272.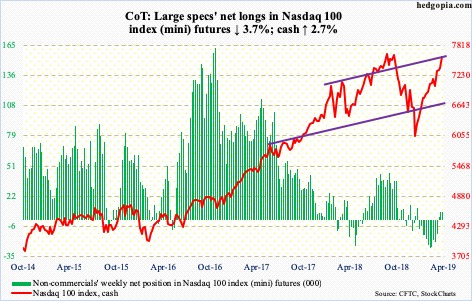
The cash (7578.84) is merely 1.6 percent from the all-time high of 7700.56 from October 1 last year. Having rallied in 14 of the last 15 weeks, the Nasdaq 100 index is stretched. That being said, bulls possess the ball. The weekly gravestone doji from three weeks ago has been negated. Shorter-term averages are still rising, with a golden cross (50/200) on Tuesday. Until bears succeed in pushing the index below 7200, it is bulls’ ball to lose, although they wish flows – as well as non-commercials – cooperated a bit more.
In the week to Wednesday, QQQ (Invesco QQQ trust) lost $1.1 billion (courtesy of ETF.com). This followed loss of $1.5 billion in the prior week.
Russell 2000 mini-index: Currently net short 9.3k, down 9.9k.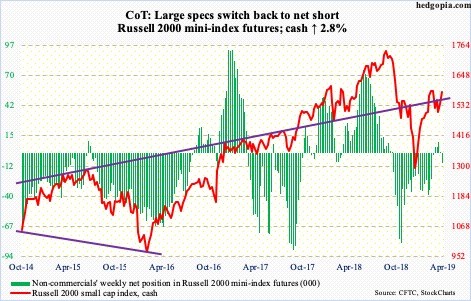
After getting rejected on February 25 just north of 1600, the cash (1582.56) made lower highs and lower lows. On Wednesday, it broke out of the resulting descending channel. On Friday, the 200-day (1574.42) was taken care of. Of major US indices, the Russell 2000 was the last to capture that average. Next comes 1600-plus, which goes back to January last year.
Bulls would hope the descending channel is part of a bull flag. The first step toward realizing that would be recapturing of 1600-plus. For that, cooperation from flows is needed, which, if anything, has been a hit and miss. And, of course, from non-commercials, who went back to net short this week.
In the week ended Wednesday, IJR (iShares core S&P small-cap ETF) attracted $198 million, while IWM (iShares Russell 2000 ETF) lost $307 million (courtesy of ETF.com).
US Dollar Index: Currently net long 28.8k, up 3.6k.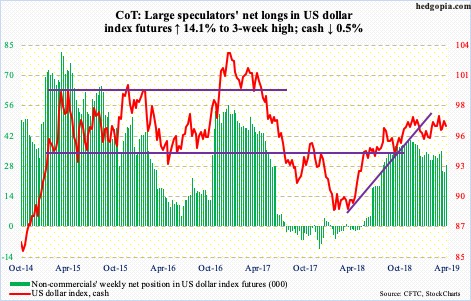
The cash (96.49) rallied to 97.1 intraday Tuesday before reversing. Decent resistance lies at 97.50s, which was not even tested. Rally attempts failed at that level several times in the past five months. The daily is overbought.
Where the US dollar index trades currently, there is a confluence of support and resistance. For several months now, it has essentially gone sideways within a rather wide range. Just north of 96 lies trend-line support from lows of one year ago. Below that around 95.60s lies similar trend-line support from last September.
VIX: Currently net short 141.5k, up 23.3k.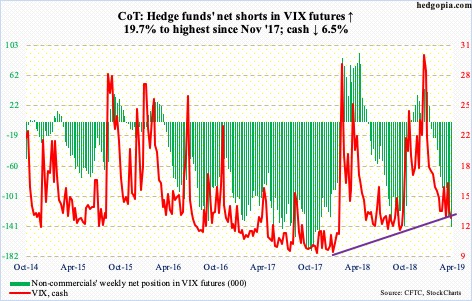
The cash (12.82) continues to hug the 12 line but at the same time is unable to rally off of it. Friday’s intraday low of 12.17 was the lowest since October last year. VIX peaked at 36.20 on Boxing Day. Until stocks cliff-dove early October last year, the volatility index routinely fell to 10-11. As a matter of fact, its all-time low of 8.56 was recorded in November 2017.
From volatility bulls’ perspective, this is a positive. But until a higher high is scored, they will continue to struggle to regain momentum. Since the late-December high, VIX gas consistently made lower highs – 22.02 on January 23, 18.33 on March 8 and 17.85 on March 25.
For whatever it is worth, non-commercials’ current holdings are higher than they had early October when VIX peaked and stocks cratered. Something to consider.


