
CoT; Futures Positions This Week
Following futures positions of non-commercials are as of April 23, 2019.
10-year note: Currently net short 323.8k, up 48.1k.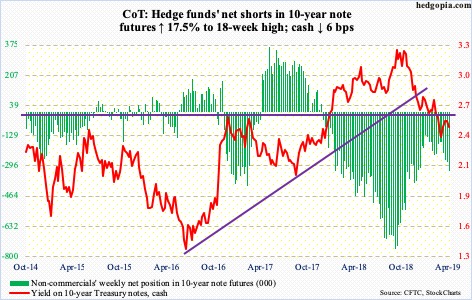
After getting rejected at 2.61 percent Wednesday last week, the 10-year Treasury yield (2.51 percent) went after that level again this week. Both Monday and Tuesday, it retreated after touching 2.59 percent, which was just above the 50-day moving average. Support-turned-resistance at 2.62 percent is a crucial level going back a decade.
Bond bears can take consolation in the fact that shorter-term moving averages have turned up, although yields closed out the week below both. The 10-year bottomed late March at 2.36 percent. Non-commercials are betting the uptrend continues. They have added to their net shorts in 10-year note futures the past five weeks. But unless 2.62 percent is decisively recaptured, their aggression just might contribute toward a squeeze at some point in the future, causing rates to go lower. Friday, the long end of the curve totally ignored the 3.2-percent print in 1Q19 real GDP; the 10-year shed three basis points.
30-year bond: Currently net short 40k, up 15.5k.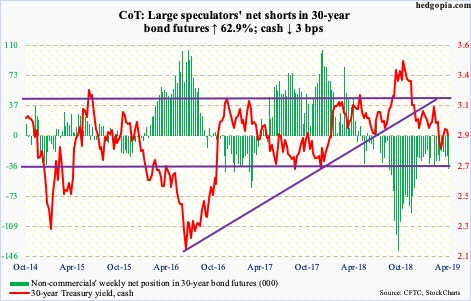
Major economic releases next week are as follows.
Personal income for March is due out Monday. In the 12 months to January, core PCE – the Fed’s favorite measure of consumer inflation – increased 1.8 percent. This was the slowest pace since February last year.
The employment cost index (1Q) and the S&P Case-Shiller home price index (February) are scheduled for Tuesday.
Private-sector compensation costs in 4Q18 increased three percent from a year ago. Wages and salaries rose 3.1 percent and benefits 2.6 percent.
Nationally, US home prices rose 4.3 percent year-over-year in January. This is a healthy pace, although prices in March last year were rising at a 6.5-percent clip.
Also Tuesday, a two-day FOMC meeting begins. Markets expect rates to be left unchanged. The Fed has already said there would be no hikes this year. The last hike was last December. More importantly, it will be interesting to hear the FOMC’s take on the recent uptick in the effective fed funds rate, which is just a few basis points from the top of the target range of 225 and 250 basis points.
Wednesday brings the ISM manufacturing index for April. March was up 1.1 points month-over-month to 55.3. Last August’s 60.8 was the highest since May 2004.
Productivity (1Q) and durable goods (March, final) are on tap Thursday.
Output/hour grew 1.9 percent annualized in 4Q18. Historically, productivity remains suppressed but has firmed up in recent quarters.
Preliminarily, March orders for non-defense capital goods ex-aircraft – proxy for business capex plans – jumped 5.3 percent y/y to a seasonally adjusted annual rate of $70 billion, a new high.
April’s employment numbers and the ISM non-manufacturing index will be published Friday.
Job growth has been erratic of late. January saw the economy add 312,000 non-farm jobs, followed by 33,000 in February and 196,000 in March, for a monthly average of 180,000.
Services activity dropped 3.6 points m/m in March to 56.1 – a 19-month low.
Crude oil: Currently net long 659.9k, up 40.7k.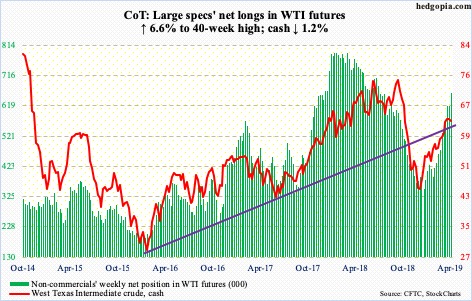
The White House Monday essentially poured oil into what was already an on-fire oil market. All US waivers on imports of Iranian oil would end next week. Saudi Arabia said it would work with other producers to make up for the shortfall. Nevertheless, traders used this as an opportunity to rally the cash ($63.30/barrel) past short-term resistance at $64.70s. Their enthusiasm proved fleeting, though. Friday, the crude shed 2.9 percent. The 50- and 200-day lie at $59.99 and $61.18 respectively. Bulls need to defend these.
WTI has come a long way. From late December through Tuesday’s intraday high of $66.60, the crude jumped 57 percent. Amidst all this, in a potentially ‘tell’ development, XLE (SPDR energy ETF) is beginning to lag WTI. Post-earnings Friday, both Exxon (XOM) and Chevron (CVX) fell.
The EIA report for the week ended April 19 was a mixed bag. US crude production jumped 100,000 barrels per day to match a two-week-old record of 12.2 million bpd. Crude imports jumped 1.2 mbpd to 7.1 mbpd. Crude stocks increased 5.5 million barrels to 460.6 million barrels. Stocks of gasoline and distillates, however, fell – respectively by 2.1 million barrels and 662,000 barrels to 225.8 million barrels and 127 million barrels. Refinery utilization expanded 2.4 percentage points to 90.1 percent.
E-mini S&P 500: Currently net long 2.4k, down 13.5k.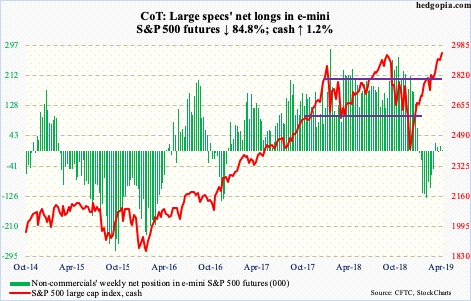
Friday, the cash (2939.88) closed within 1.03 points from the record high set last September. From late December, it is up north of 25 percent. Shorts contributed. By mid-April, short interest on SPY (SPDR S&P 500 ETF) is down 35.8 percent year-to-date to the lowest since December 2017; back then, the S&P 500 began a quick, nasty correction in January last year. Things are likely setting up for a similar correction in the weeks/months to come.
Flows remain a problem, although bulls must like the most recent trend in money markets. After attracting $9.8 billion in the prior two weeks, US-based equity funds lost $7.3 billion in the week to Wednesday (courtesy of Lipper). In the same week, SPY, VOO (Vanguard S&P 500 ETF) and IVV (iShares core S&P 500 ETF) lost a combined $4.2 billion. This followed inflows of $15.8 billion in the prior three (courtesy of ETF.com).
Near-term, though, bulls possess the momentum ball. On both Thursday and Friday, they bought at the rising 10-day.
Euro: Currently net short 105.4k, up 7.4k.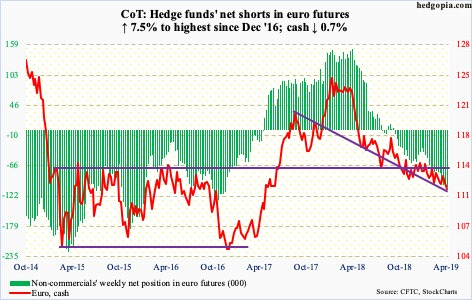
The cash ($111.57) broke down. For several sessions last week, bulls tried to break through the 50-day, but in vain. The intraday high of $113.24 posted 10 sessions ago was yet another lower high in a series of lower highs since the euro peaked at $125.37 in January last year. Arguably, it was only a matter of time before support at $112 – or $111.80s – gave away, and it has. For bulls, this can prove costly unless they quickly launch into damage-repair mode. Some signs of stability showed up in the last two sessions.
Gold: Currently net long 37.4k, down 18.9k.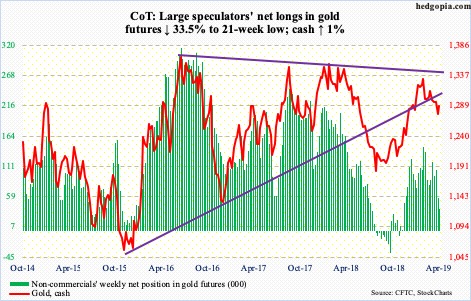
GLD (SPDR gold ETF) and IAU (iShares gold trust) continued to bleed in the week through Wednesday – $83 million and $204 million respectively (courtesy of ETF.com). GLD’s loss follows outflows of $1.3 billion in the prior three weeks. Concurrently, non-commercials cut back their net longs to a 21-week low.
Gold bugs, however, must be pleased – relatively – with how the cash ($1,288.80/ounce) fared this week. Last week, gold lost support at $1,280s. Tuesday, the metal dropped to $1,267.90 intraday before bids showed up. The daily is oversold. The next bull-bear tug of war likely takes place at $1,300. The 50-day lies at $1,302.08.
Nasdaq 100 index (mini): Currently net short 6k, down 2.5k.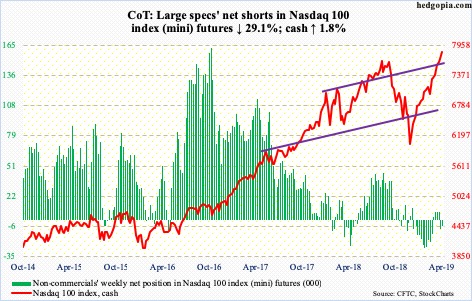
Yet another week and yet another high on the cash (7826.68). Thursday’s intraday high of 7851.97 kissed the rising daily upper Bollinger band. Tuesday, the daily RSI crossed 81. Flows are healthy. In the week to Wednesday, QQQ (Invesco QQQ trust) took in another $997 million. In the prior two, $1.8 billion came in (courtesy of ETF.com).
Except for Apple (AAPL) and Alphabet (GOOG/L), most major tech firms have reported their March quarter. The earnings bar was low, and bulls did a good job of exploiting this. This is where unwinding of the overbought condition the Nasdaq 100 is in can begin. Something to watch out for. Nearest support lies at 7700, which was also the prior high from last October.
Russell 2000 mini-index: Currently net short 18.9k, up 2.1k.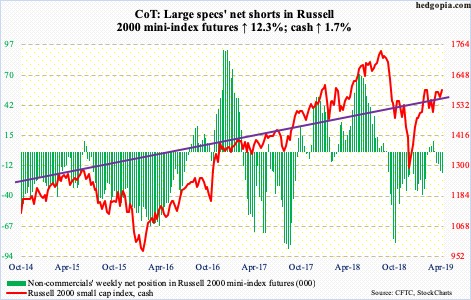
Once again, small-cap bulls went after 1600 on the cash (1591.82) and once again they were denied. Wednesday, the Russell 2000 pulled back from 1594.03 before buyers showed up at the 50- and 200-day – 1562.03 and 1567.69, in that order. Right around there rests a rising trend line from late December. Selling likely accelerates once this support gives in.
In the week to Wednesday, $306 million came out of IWM (iShares Russell 2000 ETF), even as IJR (iShares core S&P small-cap ETF) saw no activity (courtesy of ETF.com). Non-commercials have remained net short the past four weeks.
US Dollar Index: Currently net long 28.8k, down 183.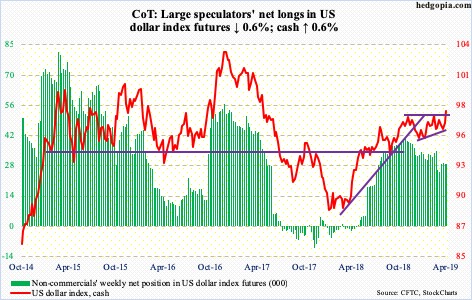
Beginning last September when it made a low of 93.39, the cash (97.92) consistently made higher lows. At the same time, bulls were getting denied at 97-97.50. The resulting ascending triangle was resolved on the upside this week. If it is a genuine breakout, retest – likely soon – should hold. Both the 50- and 200-day are now rising.
VIX: Currently net short 177.8k, up 7.8k.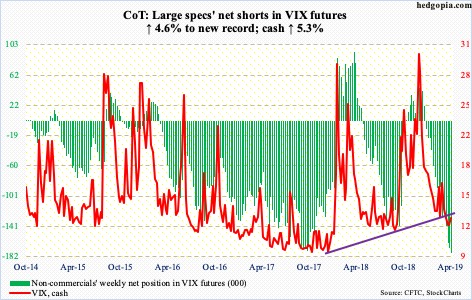
The cash (12.73) dropped from 36.20 late December to 11.03 last week, which was the lowest since last August. Last week also produced a weekly spinning top, which also formed this week. Volatility is setting up to rally. Daily Bollinger bands have contracted quite a bit. The 50-day, which repelled rally attempts for three months, is trying to flatten out. Medium- to longer-term, too, should a historical relationship between VIX and the fed funds rate hold, volatility’s path of least resistance is up (more on this here). The record net shorts non-commercials have accumulated should lend a helping hand in this. Their holdings are much higher than what they had back in January-February and October-December last year – right before the cash exploded.
UUP UDN TNX TLT OILB FXE XLF XOM CVX SPY VOO IVV GLD IAU QQQ IWM IJR VIX


