
CoT: Futures Positions For The Week
The following futures positions of non-commercials are as of June 11, 2019.
10-year note: Currently net short 366k, down 101.7k.
Tuesday’s intraday high of 2.17 percent on the 10-year Treasury yield predictably attracted bond bulls. There was gap-down resistance from May 31, and it held. Rates came under pressure in the next three sessions but the drop was not enough to take out last Friday’s low of 2.05 percent, which came pretty close to testing the September 2017 low of 2.03 percent. A breach of this will only add to momentum intact since the 10-year peaked at 3.25 percent last October. Since then, there has been a pattern of lower highs and lower lows.
The past couple of weeks, the 10-year (2.09 percent) has essentially gone sideways, which is what is needed should bond bears (price) are to get a relief rally in yields. On the way down, they lost major support at 2.62 percent, which goes back a decade. This was then followed by a loss three weeks ago of 2.36 percent. If sideways action continues in the next several sessions and shorter-term averages turn up, 2.36 percent is the path of least resistance. The 50-day moving average, currently 2.39 percent and dropping, should get there in the next several sessions.
30-year bond: Currently net long 18.2k, up 27.7k.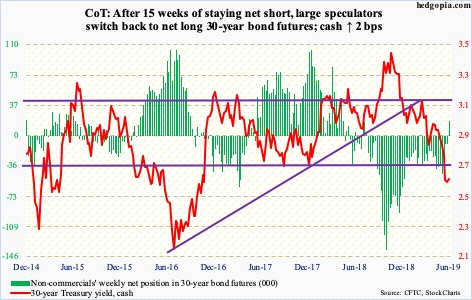
Major economic releases next week are as follows.
Monday brings the NAHB housing market index for June. In May, home builder activity rose three points month-over-month to 66. The cycle high 74 was reached in December 2017, which was the highest since July 1999.
Housing starts for May are on tap for Tuesday. April was up 5.7 percent m/m to a seasonally adjusted annual rate of 1.24 million units. The cycle high 1.34 million was reached in January last year, which was the highest since July 2007.
Also Tuesday, a two-day FOMC meeting begins. No change is expected. The last action they took was a 25-basis-point raise last December, to 225 to 250 basis points. For the remainder of the year, markets have aggressively priced in at least a couple of 25-basis-point cuts beginning July. It will be interesting if Chair Jerome Powell drops any hints as to if markets are overly optimistic.
May’s existing home Sales come out Friday. April sales edged down 0.4 percent m/m to 5.19 million units (SAAR). Sales have weakened since posting 5.72 million in November 2017, which was the highest since February 2007.
Crude oil: Currently net long 481.5k, down 46.9k.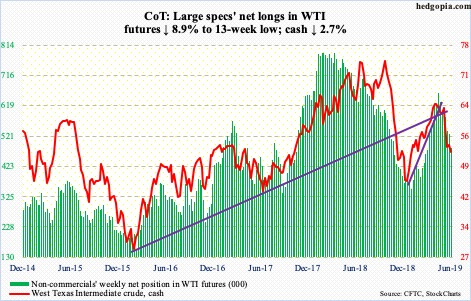
The week began with an unsuccessful test of broken-support-turned-resistance at $54-55/barrel. There was a similar failed attempt last week. Thursday, the cash ($52.51) rallied 2.2 percent responding to the Strait of Hormuz attack on two oil tankers, but it was not enough to again test that resistance. The crude has essentially gone sideways the past couple of weeks. This preceded a drop from $66.60/barrel on April 23 through $50.60 on June 5. Thus far, support at $50-51 has held. As long as a breach does not occur, consolidation around here should help the crude eventually unwind its daily oversold condition. After $54-55, the next layer of resistance lies at $57-58.
The EIA report for the week of June 7 was a mixed bag. US crude production fell 100,000 barrels per day from prior week’s record 12.4 million bpd. Crude imports dropped 316,000 bpd to 7.6 mbpd. Distillate stocks declined one million barrels to 128.4 million barrels. Stocks of crude and gasoline, however, rose – up 2.2 million barrels and 764,000 barrels to 485.5 million barrels and 234.9 million barrels, respectively. Refinery utilization rose 1.4 percentage points to 93.2 percent.
E-mini S&P 500: Currently net long 54.9k, down 35k.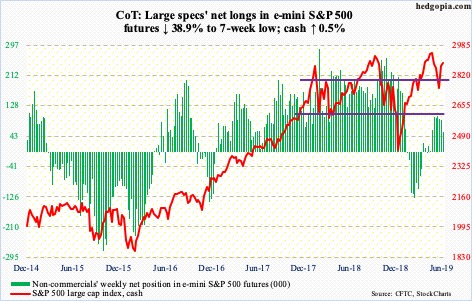
In the week to Wednesday, US-based equity funds took in $4.4 billion (courtesy of Lipper). In the same week, SPY (SPDR S&P 500 ETF), VOO (Vanguard S&P 500 ETF) and IVV (iShares core S&P 500 ETF) gained a combined $4.5 billion (courtesy of ETF.com). In the prior two weeks, $6 billion came out of these ETFs and $34.2 billion out of the funds.
Last week’s 4.4-percent jump in the cash (2886.98) seemed to have done the trick. The S&P 500 index opened the week with a rally past the 50-day (2873.94) but was not able to build much on it. Monday produced a gravestone doji and Friday a doji – right above the 50-day. Short-term resistance at 2890s held firm. Plus, through Tuesday’s high, it rallied 6.6 percent intraday in seven sessions. Digestion only makes sense. The daily is now extended.
Euro: Currently net short 86.8k, down 759.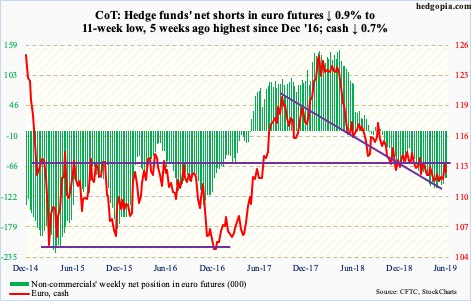
The cash ($112.58) Wednesday went after last Friday’s intraday high of $113.48, but to no avail. Through that high, it has had a very good six-session run, having bottomed at $111.16 on May 30. The daily is itching to go lower. During that run, the euro reclaimed the 50-day, which was lost Friday. Since late April, support just north of $111 has been successfully tested several times.
Gold: Currently net long 184.2k, up 28.1k.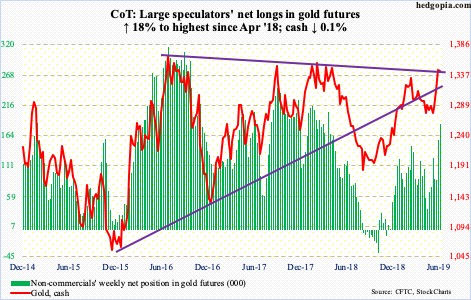
Gold bugs went after major resistance at $1,350s-1,360s big time on Friday, with an intraday high of $1,362.20, but only to close at $1,344.50/ounce. This could prove to be an important reversal. The weekly produced a spinning top with really long tails on each end.
This was preceded by non-commercials aggressively adding to net longs. Plus, GLD (SPDR gold ETF) took in $100 million in the week through Wednesday. In the prior three, it attracted $1 billion (courtesy of ETF.com). IAU (iShares gold trust), however, lost another $19 million – 9th straight weekly outflows; in the prior eight, $830 million was withdrawn.
The metal fell 0.1 percent for the week. For bulls’ solace, bids persistently showed up at the sharply rising 10-day. This can continue until shorter-term averages at least flatten out, odds of which have risen after Friday’s reversal.
Nasdaq 100 index (mini): Currently net long 11.6k, up 7.4k.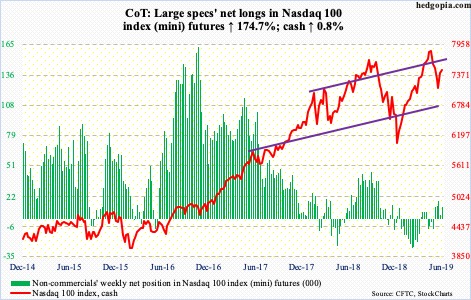
The cash (7479.11) pretty much straddled the 50-day this week. This preceded a 9.5-percent, seven-session rally through Tuesday’s intraday high. The knock against this is that it increasingly came on declining volume. Nonetheless, right here and now, price is what matters, and from that perspective, bulls should be happy. They should also be happy with the $1.5 billion that moved into QQQ (Invesco QQQ trust) in the week ended Wednesday (courtesy of ETF.com).
The daily has rallied into overbought territory. A gravestone doji showed up on the weekly. In the event of a pullback, bulls need to be able to defend the now-rising shorter-term averages – 1.7 percent away. Inability to do so opens the door to a test of the 200-day (7148.33) and, worse, recent lows (6936.68 on June 3).
Russell 2000 mini-index: Currently net short 41.8k, up 13k.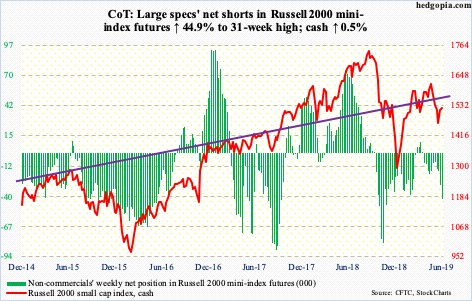
Of major US equity indices, small-caps continue to lag. Over the seven sessions from the June 3rd low through Tuesday’s high, the cash (1522.50) rallied 5.2 percent. The Russell 2000 index continues to remain below both the 50- and 200-day. The latter (1541.78) in particular is downward sloping and is not that far away. Right above is the 50-day (1550.04) and the daily upper Bollinger band (1552.44) after that. Resistance is massive.
This is particularly so when flows continue to be on and off. In the week through Wednesday, IWM (iShares Russell 2000 ETF) lost $332 million, while IJR (iShares core S&P small-cap ETF) gained $15 million (courtesy of ETF.com).
US Dollar Index: Currently net long 24k, down 2.2k.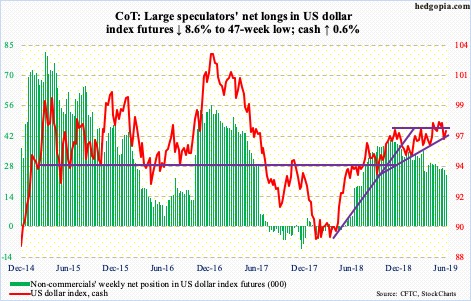
Thursday’s intraday low of 96.35 came pretty close to testing the 200-day (96.25). That low also tested – successfully – rising trend-line support from last September.
The daily is oversold. Should the cash (97.07) draw bids – likely – the 50-day lies at 97.23. After that lies resistance at 97.50s. The latter makes up the upper bound of a potential ascending triangle. There was a false breakout late April.
VIX: Currently net short 91.2k, up 5.7k.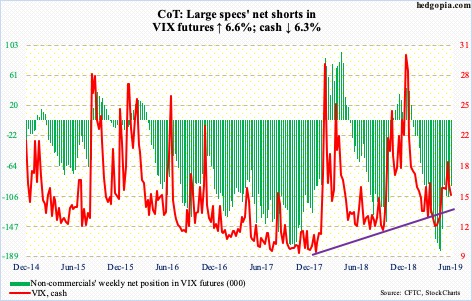
By Tuesday’s intraday high, the S&P 500 was up 1.3 percent for the week, but it was not until Friday the cash (15.28) breached last week’s low of 15.33. Throughout the week, VIX pretty much went sideways just above the 50-day (15.25).
Once again, the daily Bollinger bands are narrowing. Late April, the spread contracted to 2.3 points – just before VIX surged, peaking at 23.38 by May 9. Friday’s spread was 4.38 points.
If VIX arguably is holding its ground, elsewhere in the options market investor fear, which built up as stocks sold off in May, is unwinding. The 21-day moving average of the CBOE equity-only put-to-call ratio, which reached 0.706 on June 5, ended the week at 0.674. In normal circumstances, continued unwinding can help stocks. For this scenario to come to fruition, VIX needs to breach the 50-day and head lower.
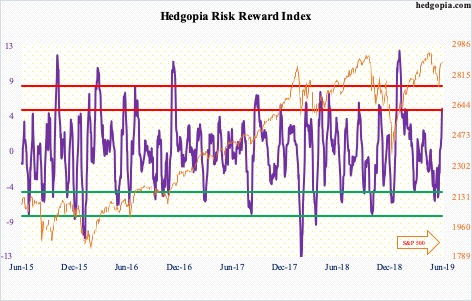
For whatever it is worth, our own Hedgopia Risk Reward Index just entered the red zone.


