
Costco Wholesale Corporation (COST) went public on December 5, 1985 at $10.00 per share (before stock splits). It’s considered as one of the good performing stocks with only 9 negative years out of 37.

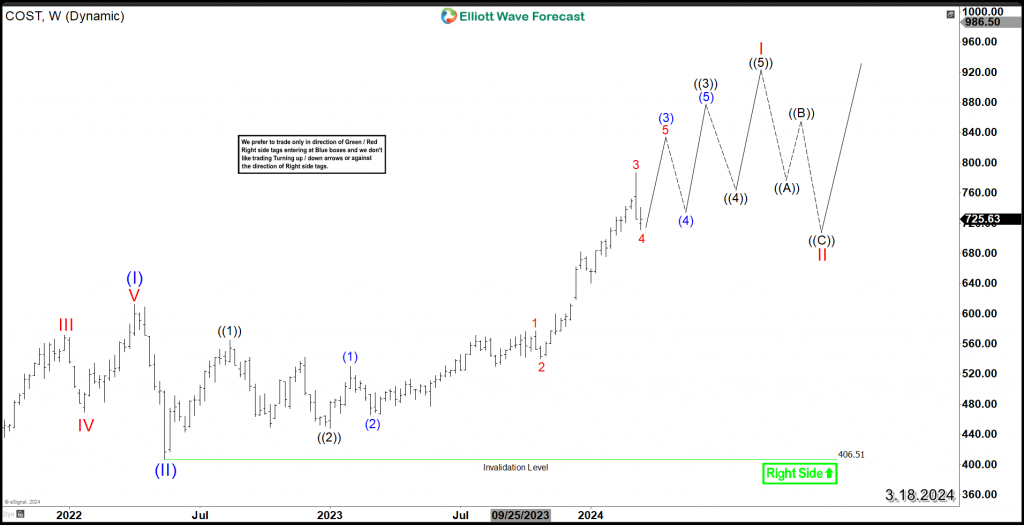
Last month, we discussed in our previous article the continuation to the upside within daily cycle as the stock is looking to remain supported within an impulsive rally since 2022 low. As we can see in the below weekly chart, the rally remains in progress within a nesting structure still part of wave I. It’s expected to see more upside within series of 3rd and 4th waves until it establishes a complete impulse (5 wave advance) then a 3 wave pullback in wave II can take place against $406.51.
Costco Weekly Chart 3.18.2024
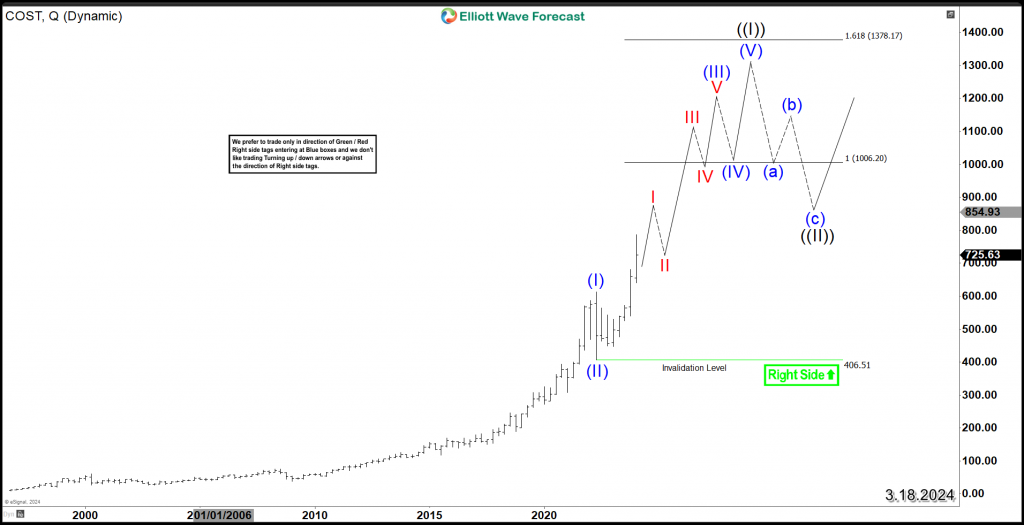
Zooming out to the quarterly chart, we see the Grand Super Cycle unfolding within a larger 5 waves advance since IPO. The break higher above 2022 peak created a new yearly bullish sequence which is expected to support the impulsive advance toward an initial target at equal legs area $1006 – $1378. Consequently, COST is still trading within the first leg of wave (III) which implies a strong breakout in progress and the stock will remain supported in the coming years until it reaches the mentioned target area.
The overall technical picture for Costco is bullish in all time frames. Therefore, investors are advised to only look for buying opportunities during pullbacks in 3 , 7 or 11 swings based on the Elliott Wave Theory.
Costco Quarterly Chart 3.18.2024
More By This Author:
Buying Opportunity In Marathon Digital Holdings In 7 SwingsDAX Short Term Should Stay Supported
Oil Elliott Wave: Buying The Dips At The Blue Box


Comments
Log in or sign up to join the conversation.