
Conservative Investors: Step Up!
Back on September 20, 2018, I posed the question: Should conservative investors take the paper bags off their heads? and offered some stock ideas for those inclined to answer in the affirmative. Since then, the market has had some rocky episodes (see, e.g., tech, FANG stocks, trade, worsening political tribalism, etc.). But that’s not necessarily why I’m now suggesting that those averse to risk should do more than uncover their heads and should step up, step out and start preaching. It’s about the investment community’s nearly 2-year party and precedent that suggests this sort of thing has a limited shelf life.

Reign In Risk
Academicians and investment practitioners have long been well versed in notions of risk and how it interacts with return. But even now, decades after we nailed all this down from a theoretical standpoint, it can still be hard to truly understand what it means in human terms. I still recall the Herculean but ultimately unsuccessful effort I made back in my Reuters days to try to explain to an editor who reported to the news organization what the CBOE Volatility Index (VIX) was all about; I ultimately gave up trying to explain that neither a rising VIX nor a falling VIX was bullish or bearish for the stock market
In the spirit of erecting a wall, a taller one than Trump dreams of for our southern border, between risk and return, understand that I am not now offering a forecast of the general direction of stock prices. The topic for today is a risk, and I’m speaking to those who, based on whatever analysis or tea leaves they choose to read or policy they need to follow, are going to be in U.S. equities for the foreseeable future. My goal. is to address the kinds of equities I believe should be favored.
On September 20th, I semi-sheepishly suggested that lower-risk stocks get more love than they’ve had over the past couple of years. Today, I’m doubling down based on what I think maybe a more stark picture of what’s been going on out there.
Attitude Indicators
There’s no shortage of market indicators out there, even sentiment indicators. Most are based, if not on survey or economic bean counting, on price and volume. But with the wealth of specialized ETFs that have come out over the past decade or so, we now have at our disposal a bunch of new ways we can measure things.
As interesting as something like VIX is in measuring risk, it’s only useful for those who really get the mathematics of the market. For normal humans, it's just a misinterpretation waiting to be acted upon. So taking some dabs from the contemporary palette of strategy-focused ETFs, I came up with a 2.5-component suite of trends one could calculate, observe, and try to use as a basis for understanding.
Each trend measures the daily percent change of ETF “A” relative to ETF “B” with A and B being logical opposites. Here’s the trio:
- GV, or Growth over Value, represented by the iShares Russell 1000 Growth ETF (IWF) compared to the iShares Russell 1000 Value ETF (IWD).
- MC or Momentum over Conservatism, represented by the iShares Edge MSCI USA Momentum Factor ETF (MTUM) versus the iShares Edge MSCI Minimum Volatility ETF (USMV)
- LS or Large over Small, represented by the large-cap iShares Russell 1000 ETF (IWB) compared to the iShares Russell Microcap ETF (IWC).
That’s three pairs of ETFs, not 2.5. Actually, though, I’m counting LS as only half an indicator and probably wouldn’t bother to use it at all except for the fact that so many investors think in terms of large versus small, as do so many quants who, still basking in the aura of Eugene Fama and Kenneth French, continue to study size as a “factor,” whether it’s significant, whether it’s a good factor, etc. Skipping the empirical data (“what” is observed) and favoring logic (“why the data is what it is), I see size-related performance driven heavily by the MC and to a lesser extent, the GV considerations. (Click here for a prior post explaining the inherent, distinct largely quality/risk-related characteristics that separate small companies form large firms.)
GV, the Growth-Value dichotomy, is as popular as that pertaining to size. Logically, it’s so-so. Value (defined by classifiers in terms of relatively low ratios such as price/earnings price/book, etc.) exists. We can see it. We can calculate it. We know whether a stock is or isn’t a so-called value stock. Growth, on the other hand, deals with expectations of the future. That cannot be known or observed. The best that can be done is infer growth status by suspending our recognition that past performance is not necessarily predictive and rely on historic growth rates and/or use high value and an assumption that stocks wouldn’t be valued high unless the investment community expected strong future growth. Neither measure of growth is perfect, but for purposes of using the Growth ETF as a proxy for investor sentiment toward that class of stocks, they’re both serviceable.
MC, the Momentum-Conservatism dichotomy, is the cleanest. Momentum is a risk-friendly approach that favors strong stocks because . . . well, because they’re strong stocks. I’m not going to try to articulate a theory that necessarily ties momentum to high risk, and I’m not even sure I can. But anyone who is active in the market, or who is an experienced observer of the market, knows full well that momentum and risk go hand in hand in the real world. Maybe it has something to do with the absence of fundamental anchors to the strong gains such stocks enjoy when the going is good, offset by the look-out-below tendencies these stock exhibit when the untethered gains are suddenly seen as unjustified. As to minimum volatility, it too is because it is. Some who seek such stocks look for stable fundamental trends; others infer such trends based on stable share price trends, and others (like me) combine both approaches.
Figures 1, 2 and 3 present the three paired returns series’ going back nearly 20 years (not all ETFs were around that long so for those that weren’t old data is inferred based on the indexes the ETFs were designed to passively track).
All trend lines are calculated such that rising lines are consistent with increasing willingness to take on more risk.
For starters, Figure 1 shows that LS trend.
Figure 1
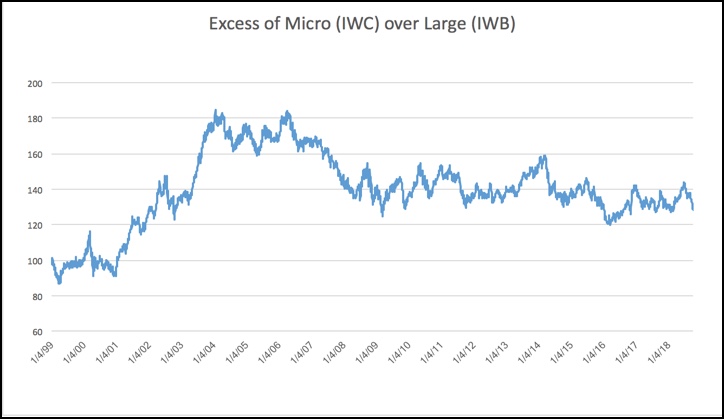
We see that small stocks were beloved early in the period, and based on the tone of older academic papers, I assume the slope was also upward during periods that preceded those covered by the chart. But from early 2004 onward, small companies received progressively less love.
Figure 2, which depicts the GV trend, is more interesting.
Figure 2
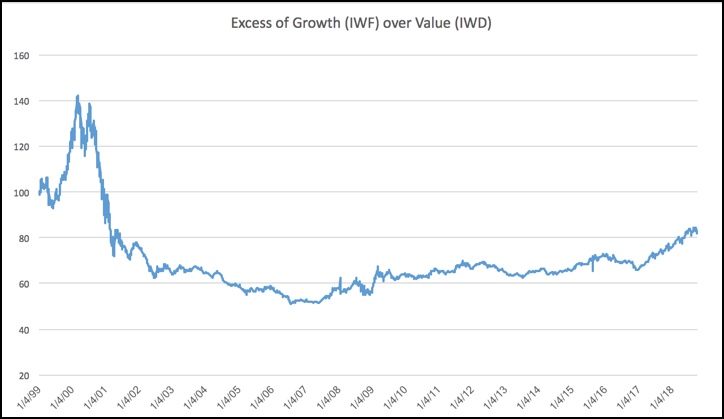
The early part of the chart, the tail end of the early dot-com bubble, shows what those of us who remember would expect to see. The market’s preference for growth was legendary and value investors were often ridiculed.
Figure 2 also helps us reminisce about how horribly that Love-Growth-Hate-Value era ended. Yep, that really was just as ugly as we remember. But then, starting around 2007, growth edged its way back to respectability. This time around, it was neither spectacular nor pathological. But it was present. (Notice how the trend passes through 2008 with barely a blip. That means the market ran away from growth and value with essentially equal vigor.)
Then came 12/14/16. I can’t remember any notable events that had occurred that day. My best guess is that the day, a little under a month after election day, marked a turning point from the Street’s worry that Trump’s election meant the end of civilization as we know it to the notion that things might actually work out well for the business community. At any rate, from that day on, its been a growth world and we’ve just been living (and investing) in it.
Now for some action. Figure 3 depicts MC...
Figure 3
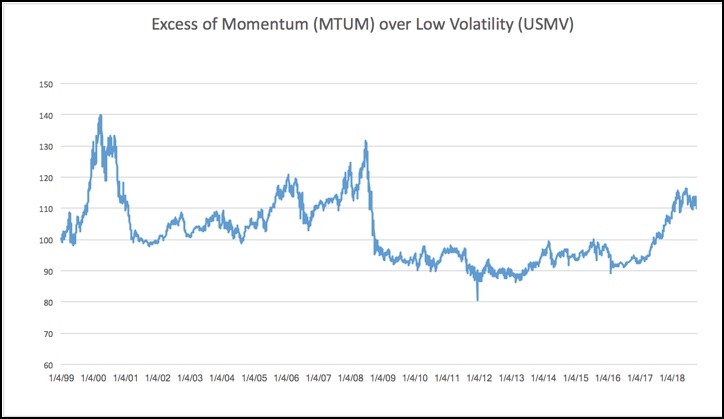
The early part of the chart, in and around the dot-com thing, looks a lot like GV only more so. No surprise there. As we all know risk was a four-letter word (the good kind, like l-o-v-e), that turned abruptly into the bad variety.
After the post-dot-com crash, risk again came into favor, but not dysfunctionally so. There was some back and forth, but with the excesses of the dot-com era washed away, the economy OK and interest rates benign, investors saw no need to get crazy about risk avoidance — but the Street had a sense of when enough was enough and dialed it back when attitudes seemed to have become too aggressive.
But then, around 2007, professional worriers were pushed aside and the boldest among us went back to flexing and strutting. We know what was going on then. The property boom was in full swing. People who may or may not have been able to spell “real estate” became magnates. And better still, the army of mathematicians, physicists, statisticians, etc. who flocked to the banks convinced themselves and their bosses that they had conquered, or at least tamed loan-default risk. That shows in the spike seen in the MC line, which peaked mid-2008. Then, well, you know . . . .
Afterward, we went back to the pre-2007 tug-of-war between M and C albeit with less intensity and conviction, until December 2016 at which time Momentum joined Growth in an upward trajectory, albeit with more intensity than Growth. Once again, we’re probably seeing the aura of the investment community’ assessment of a Trump/Republican dominated era in Washington as good for business and favorable for risk-taking . . . until March of 2018, at which time risk takers started giving conservative folks more time on stage.
What We See and Don’t See
Let’s start with what we don’t see. We see nothing about stock prices and returns. Except for the post-dot-com crash and 2008’s quick crater, we’ve been in a pretty good bull market throughout, although more questions have been raised in the most recent days.
I’m not now considering whether we should be bullish or bearish on stocks. As noted earlier, all this presumes we’re in the market and considers only what kinds of stocks we should be favoring, aggressive stocks or conservative stocks.
What we do see is that since late 2016, we’ve been in an era of aggressiveness that has, so far this century, been hard to sustain.
That doesn’t assure that things will change. Maybe this time it is different. Maybe the recent market turbulence will pass and we can go back to our sharp upward MC trajectory, accompanied, perhaps, by a dash of favorable GV. But based on unfavorable recent precedent, and the recent angst, we ought to at least not rely on projecting chart lines but should instead really think about what it would take for MC to resume its upward trajectory.
One thing we should do is cease and desist from worrying about the Fed’s recent actions to raise interest rates. Consider Figure 4.
Figure 4
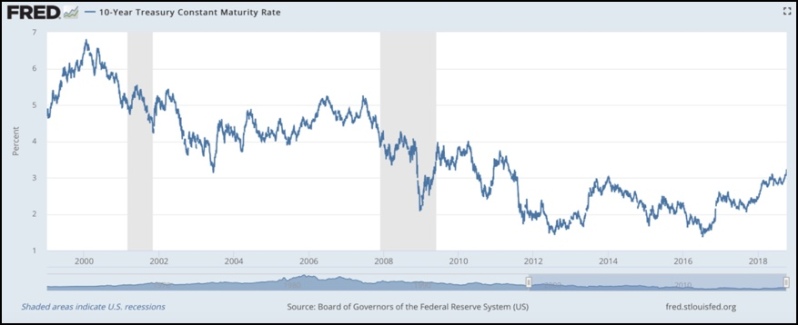
Yes, we see rates trending up now. But we’ve had other uptrends in rates this century and those haven’t precipitated a bear market.
I think it’s high time we finally deleted the old 1980s word processing files. Back then, it seemed as interest rates were the sole determinant of stock price movements. I don’t have empirical data to back it up, but my memory is such that if one were to produce a paper showing otherwise, I’d suggest that peer reviewers give it very close scrutiny (unless it was already put through for publication in which case I’d say congrats on progress toward tenure but I still don’t buy it). This is a different era. The ‘70s inflation is long dead. So, too, are the 20% or so prime rates and the 15% CD rates (plus gifts like color TVs given by banks who thought prospective depositors needed more incentive than a 15% risk-free rate to come in). And so too are the CFOs who repeatedly cited high cost of capital as the reason they were slashing investment. (If any CFO says that today, make sure you are the one who is driving if you get into a car together.)
Interest rates have not been driving stock prices so far this century (except when the Fed was pulling the market out of its two tailspins). That would likely happen in the future if rates do get to the point where cost of capital becomes troublesome. But we haven’t crossed that line yet and I don’t think we’re anywhere near it.
It's about earnings, earning, earnings, earnings and more earnings . . . earnings today and expectations of earnings growth beyond today and assessments of the likelihood things will continue to look good. Trump says it's about the pro-business regulatory environment he created. I’ll leave to others better qualified than I to assess the accuracy of that. We know about the corporate tax cut. We also know about the favorable unemployment statistics. So there is logic behind the idea of an earnings (not interest rate) driven market.
Looking Ahead
The best-case scenario for interest rates is that they remain as benign as they’ve been. Any significant change is likely to be for the worse (a reasonable assumption when one is living in the best of all possible worlds). That may occur if wage and material cost pressures, already present, worsen. But I’m not ready to forecast inflation will become troublesome enough to derail stocks.
Earnings are the big challenge. We know comparisons will decelerate tremendously in 2019 if for no other reason than the absence of the spike we got from the tax cut. It’s easy to say we know its coming and that the market has discounted it. But in the years I’ve been in this business, I’ve consistently been amazed at how often it was assumed the market that which was inescapably visible only to learn when the event finally arrived, that investors still treated it as a big surprise (both for the better and worse). As to the impact of trade tensions, your guess is as good as mine unless you’re a for-real economist in which case I’d hope your guess is a heck of a lot better than mine. Politically speaking, regarding the midterm elections and potential impact, I’m beyond guessing.
The level and seriousness of the unknowns is such as to tell me we’ve had enough risk-taking for now and that at this point, one should pull back; not necessarily stock ownership, but the risks associated with stocks one chooses to own.
Figure 3 shows I’m not alone in this. And there does seem to be some indication that investors are ok at judging when its time to cut risk. In both 2000-01 and in 2008, investors started backing away from risk well in advance of the time when risk-taking was most severely punished. I don’t want to go out on a limb and offer Figure 3 as a market-timing tool that can forecast another crash. Maybe it will eventually turn out to be something worthwhile in that regard. Maybe not. But I find it hard to make a case for defying the recent MC trend and staying out on the limb by favoring high-risk stocks.
Disclosure: None.


