
Congestion Top Forming
Current Position of the Market
SPX: Long-term trend – Is the long-term trend resuming? Is this a B-wave? Too early to tell!
Intermediate trend – The trend which started at 2346 appears to be decelerating and forming a top.
Analysis of the short-term trend is done on a daily basis with the help of hourly charts. It is an important adjunct to the analysis of daily and weekly charts which discusses the course of longer market trends.
Market Overview
Since a short-term top was diagnosed last week, very little action has followed. The SPX traded in a 50-point range which, by today’s volatile standards, has to be considered ‘sideways’. From the perspective of the rally’s 2346 low to-date, the trading of the past five week looks like deceleration and a top-building process which marks the end of a trend; although it could simply be a consolidation which will be followed by a continuation of the long-term uptrend. Since a conclusive opinion would be premature, we’ll need to let a little more time pass before venturing a more definite forecast.
There is, however, enough data to say that there are only two possibilities concerning what lies ahead. Congestion patterns do not last forever and sooner, rather than later, the index will have to decide on its next trading path -- and should do so with a resumption of price momentum which will leave no doubt about its choice. My guess is that it will be on the downside for the simple reason that after a 500-point rally, a retracement of at least a third of the distance is normal. This calls for a minimum correction of 170 points. But when the topping process is over, we will have a P&F chart pattern from which we can derive a more specific count. For now, let’s give it another week and see at what stage of completion we are by next Friday.
Chart Analysis (The charts that are shown below are courtesy of QCharts)
SPX daily chart
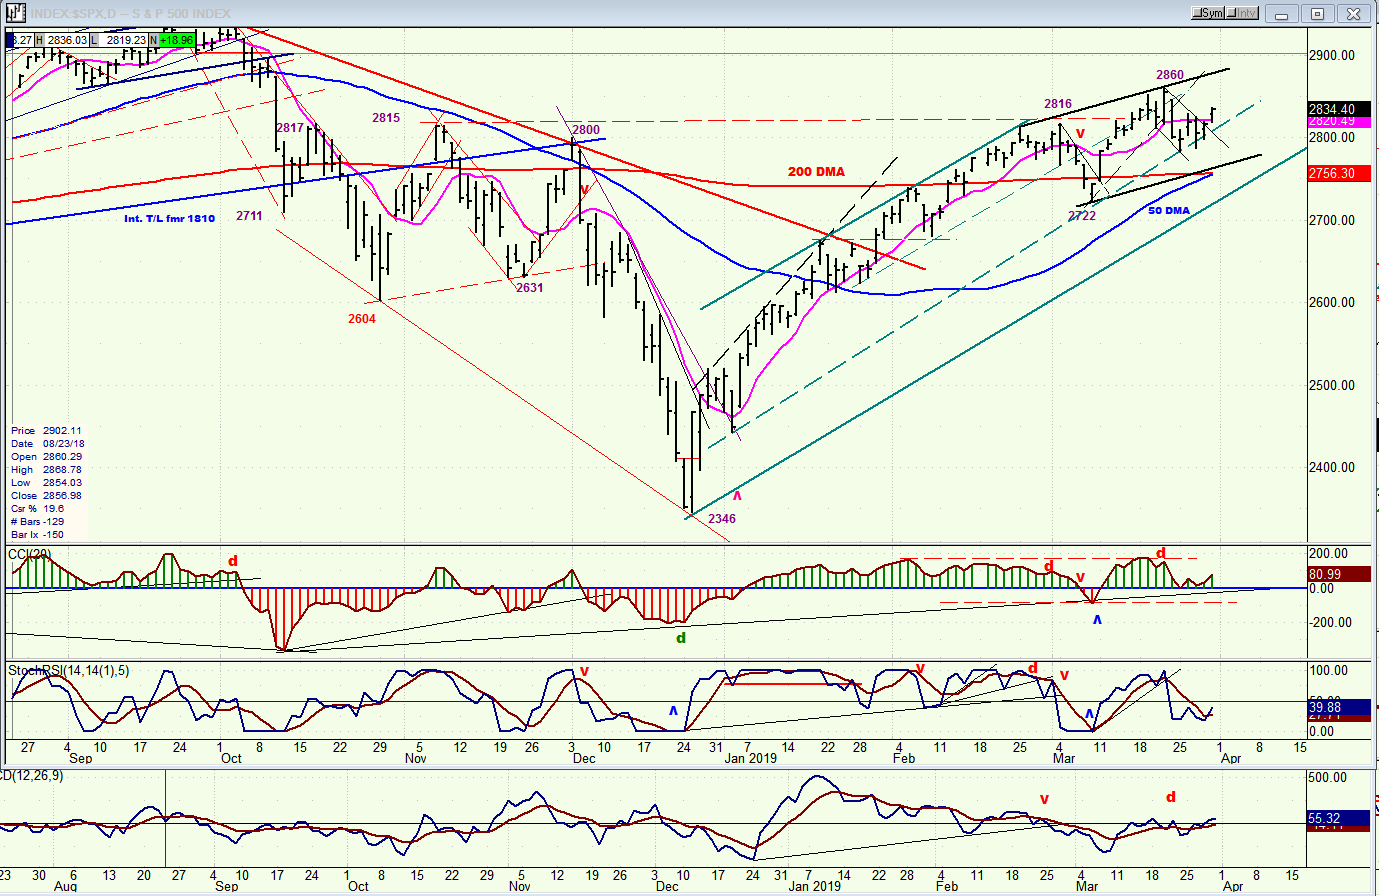
The past week’s activity has consisted of forming a small base from which the index broke to the upside on Friday. There is enough congestion within that small base to either retest the former high and even to surpass it by few points, but It does not look like the beginning of an important move which is going to alter the trend pattern from the 2346 low significantly. We remain within an up-channel having found support on the dashed trend line from the secondary low after 2346 -- the same trend line which provided support at 2722.
Prices remain within another, smaller channel which should also provide temporary support since its lower channel line is reinforced by the 50-dma and the 200-dma. Even if we start a retracement from Friday’s close, I would expect it to be confined to the 2755 level, after which more sideways action can be anticipated. Before we can have an important correction, the index would have to break out of its small channel and then out of the larger channel. I suspect that this challenge is at least two or three weeks away.
All three oscillators have become essentially neutral. It’s unlikely that they will turn decisively negative until we break outside of the small channel.
SPX hourly chart
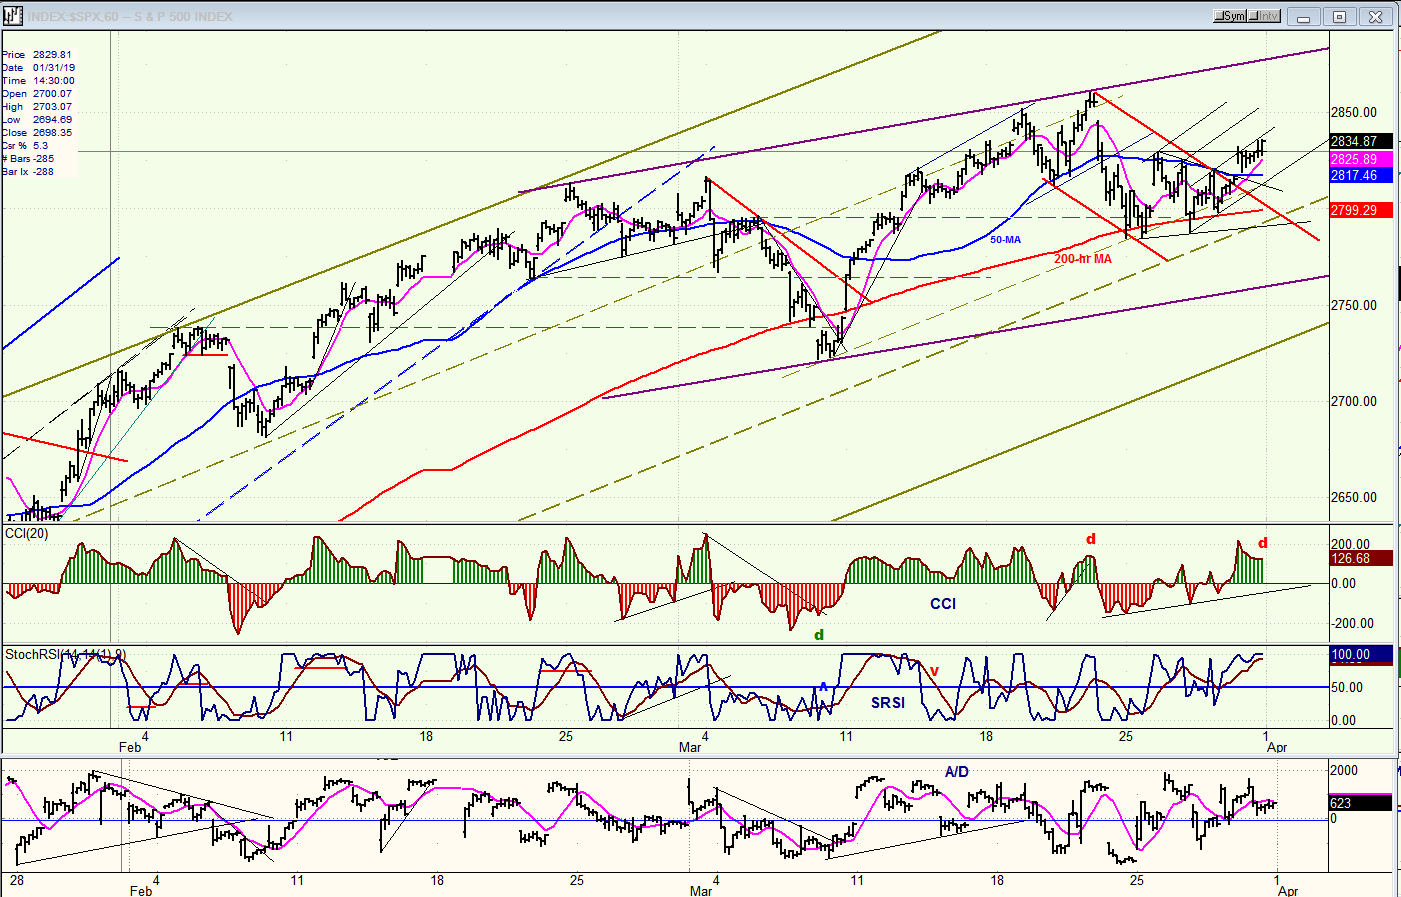
The red 200-hr MA has provided support for the index lately, but there are signs that we may be about to break below. The uptrend of the past couple of days has not been able to generate much momentum and on Friday negative divergence appeared in the CCI. Nevertheless, the small base is suggesting a move to about 2850, and there is a cycle that may have a couple more days to run before it tops. All this is iffy stuff, so we can’t attach too much certainty to it, but it does create a bias for the near-term, especially since we just came out of a small downside channel and overcame the 50-dma. And with the index trading in the middle of the channel, it has room for a little more upside before reversing. The odds of going through the top channel line at this time (or ever) are probably nil.
Even if we do break below the 200-hr MA, we should find support at the bottom of the purple channel for another bounce. Short-term and longer term, things look pretty neutral for now.
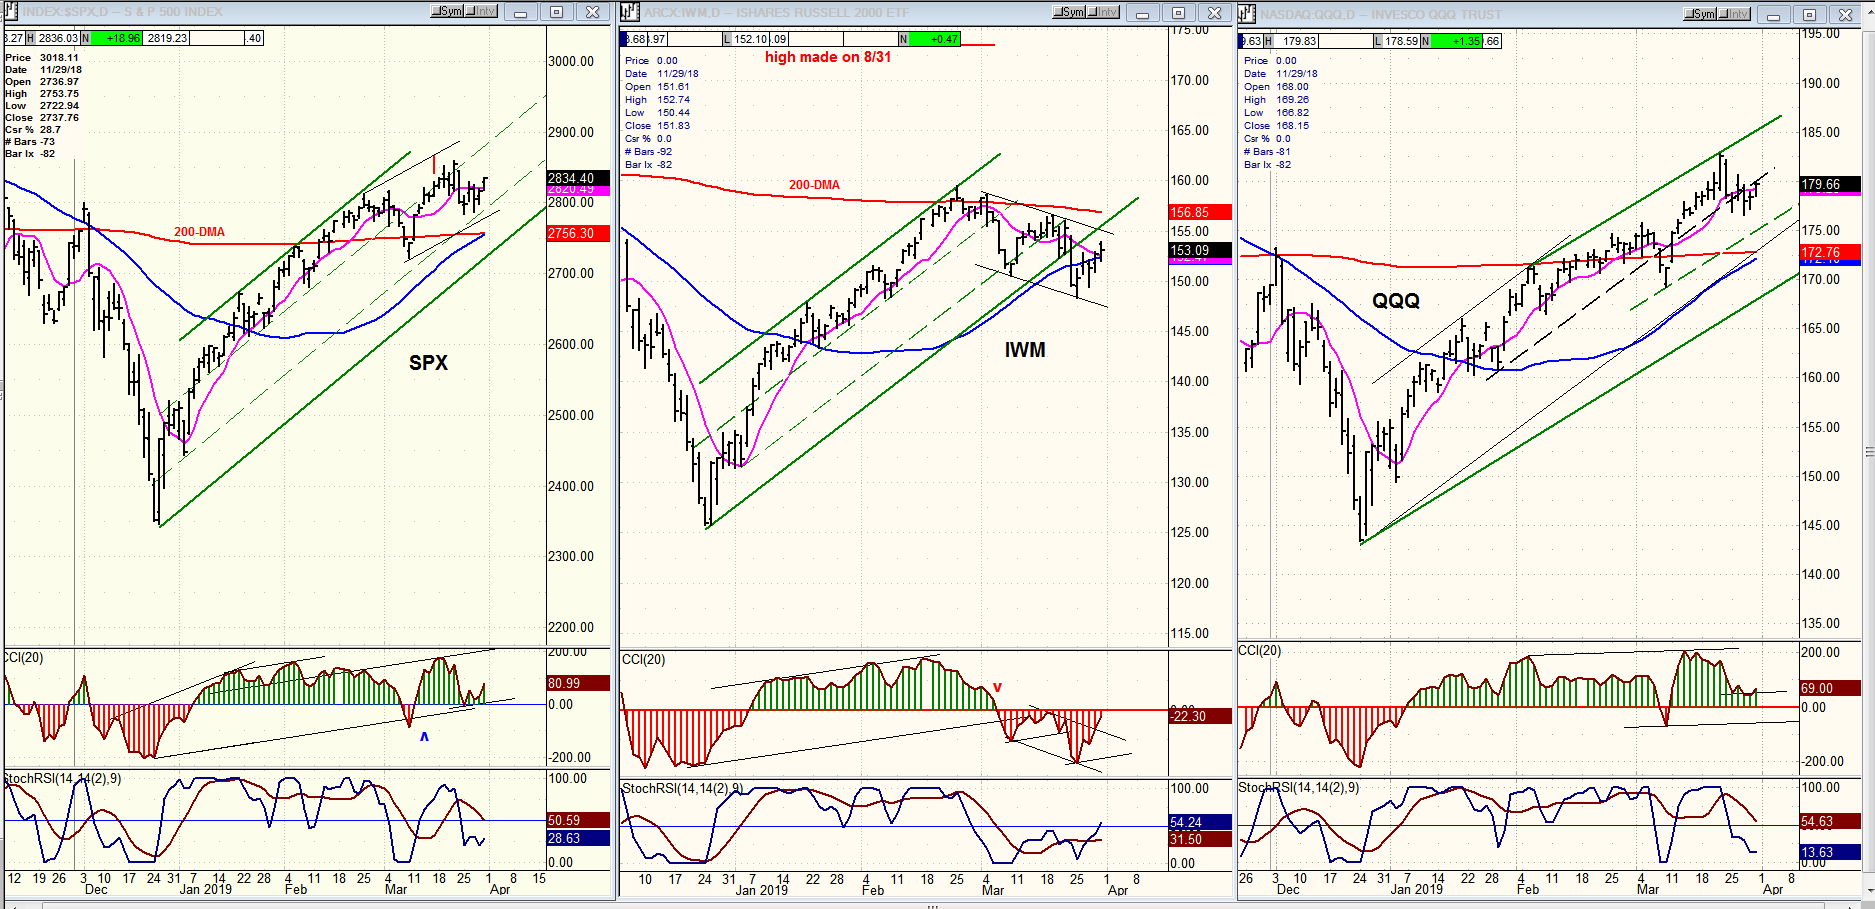
After rallying in concert with the SPX and NDX, IWM again started to show some pronounced relative weakness. It has even come out of its up-channel while the other two are still trading well within it. Although things look relatively benign over the short-term, giving its past history of leading the market what the IWM is doing has to be taken as a warning that we could be topping; but it does not necessarily mean that another steep correction is ahead, although it is still possible for this rally to be only a B-wave within the longer term trend. Until IWM begins to show less relative weakness to the other two indexes, caution is warranted.
UUP (Dollar ETF) (daily)
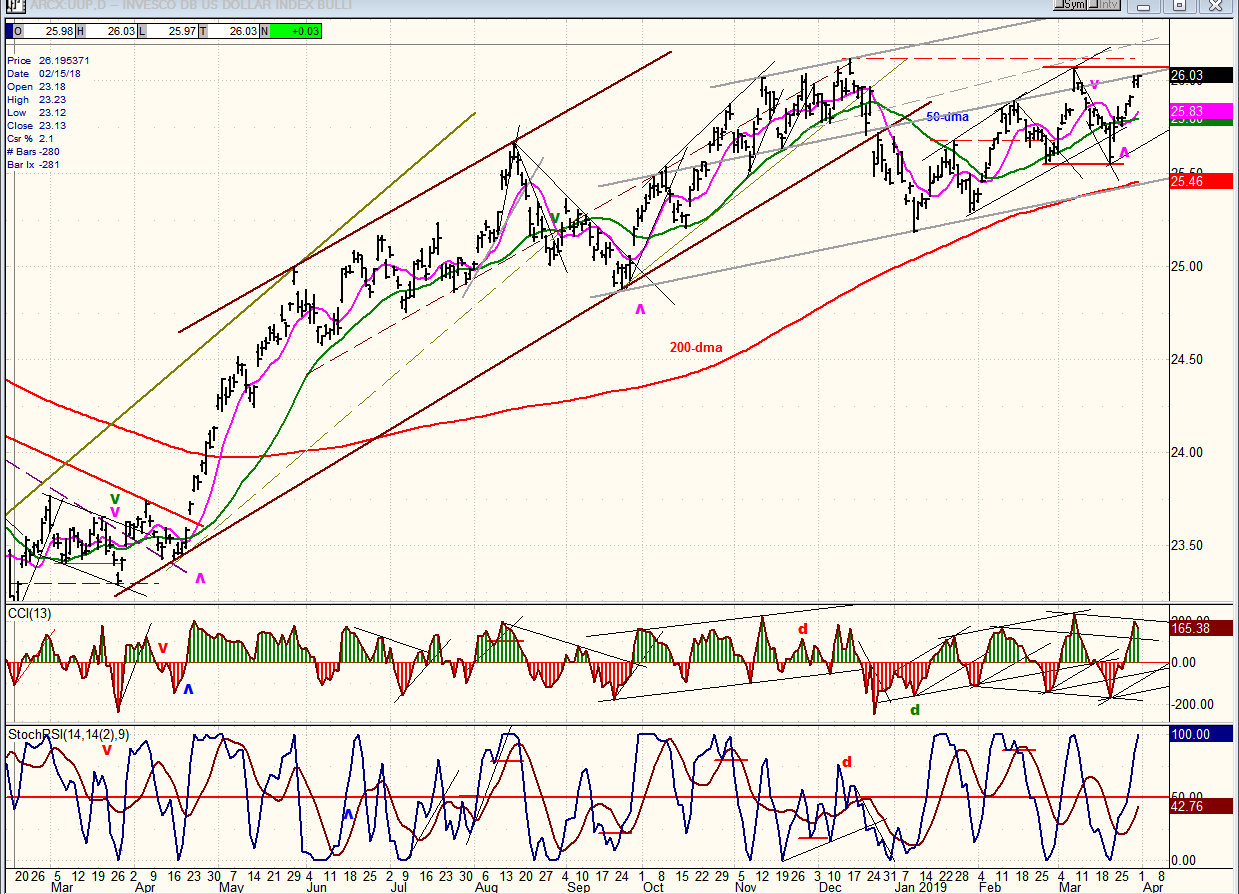
The sharp near-term correction brought about by the Fed’s decision to put interest rates on hold was short-lived. News that trade negotiations between the US and China are looking a little more positive has brought a bounce back to the near-term high. It’s now a question of whether we keep going and make a new recovery high, or if we continue to create a top with an eventual rolling over below the 200-dma. Here again, we will need more time to assess.
GDX (Gold Miners ETF) (daily)
Since last September, SPX moved from the bottom to near the top of a broad channel before pulling back. Early last week, it re-tested its recent top, but the rally in UUP brought about another pull-back. It’s now a question of whether it will continue to correct over the short-term and break below the trend line which has already been tested twice recently, or hold and have another go at the top of the larger channel. What it does may depend on what UUP does over the short-term since the two indexes have a tendency to move in opposite directions.
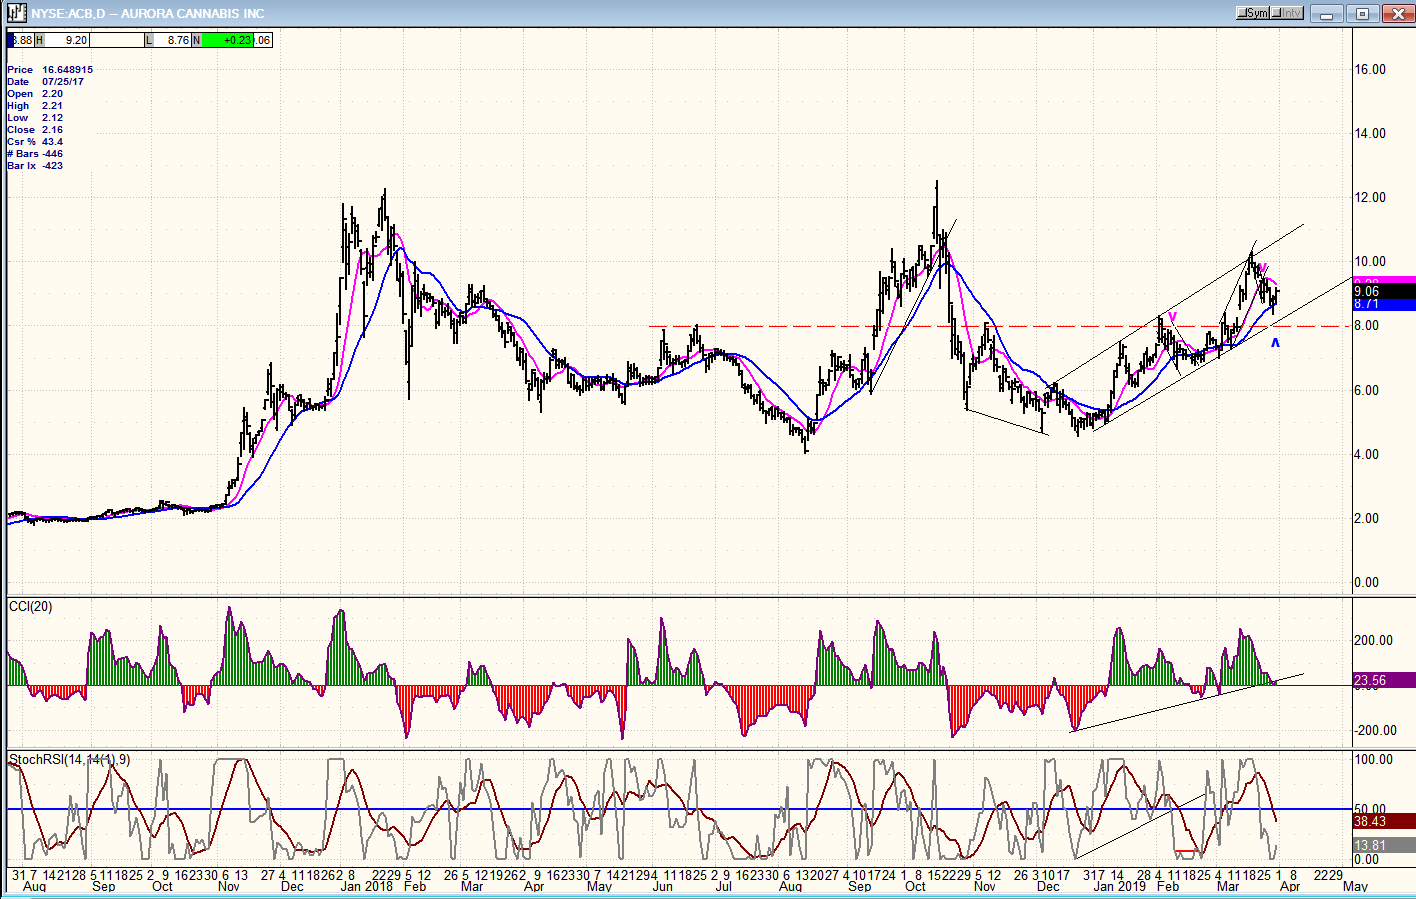
ACB (Aurora Cannabis) (daily)
ACB is in an uptrend which can continue within its current channel and reach 12.50-13.00 before another serious consolidation takes place.
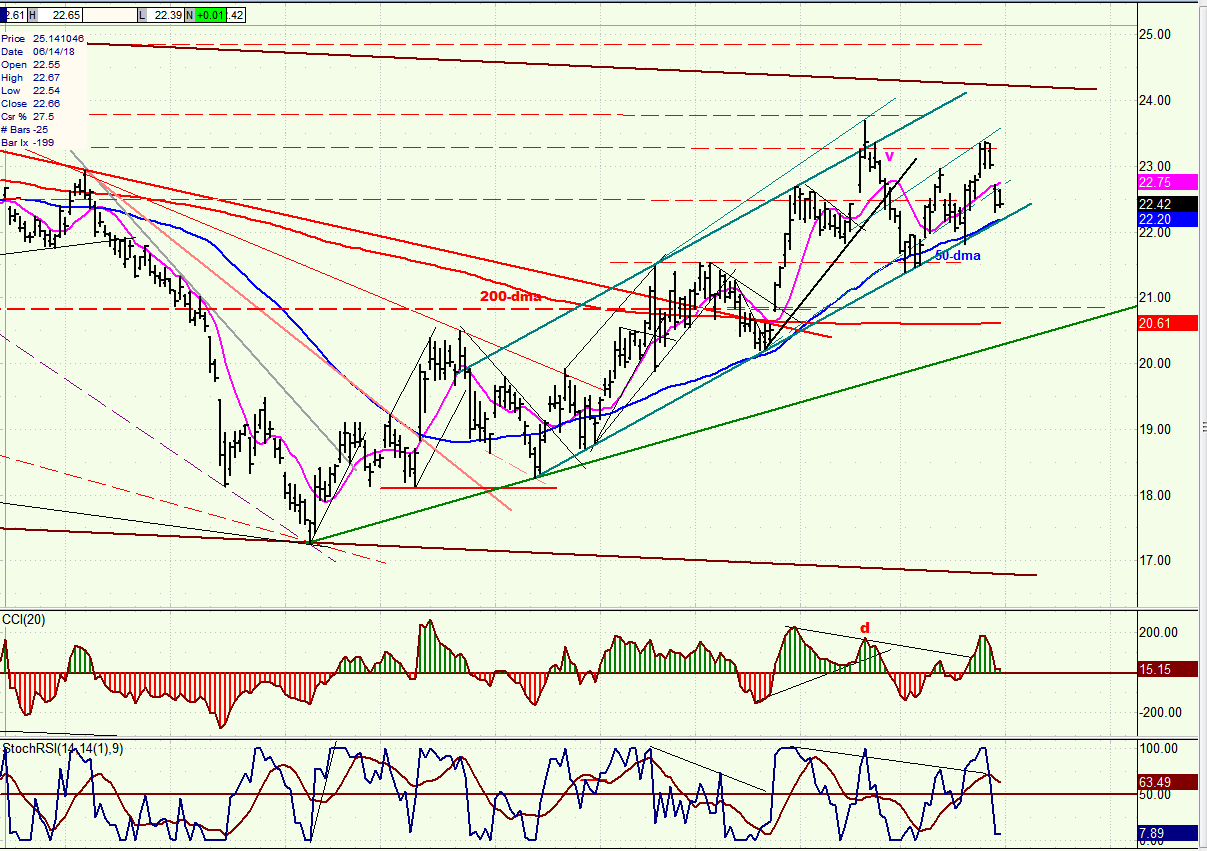
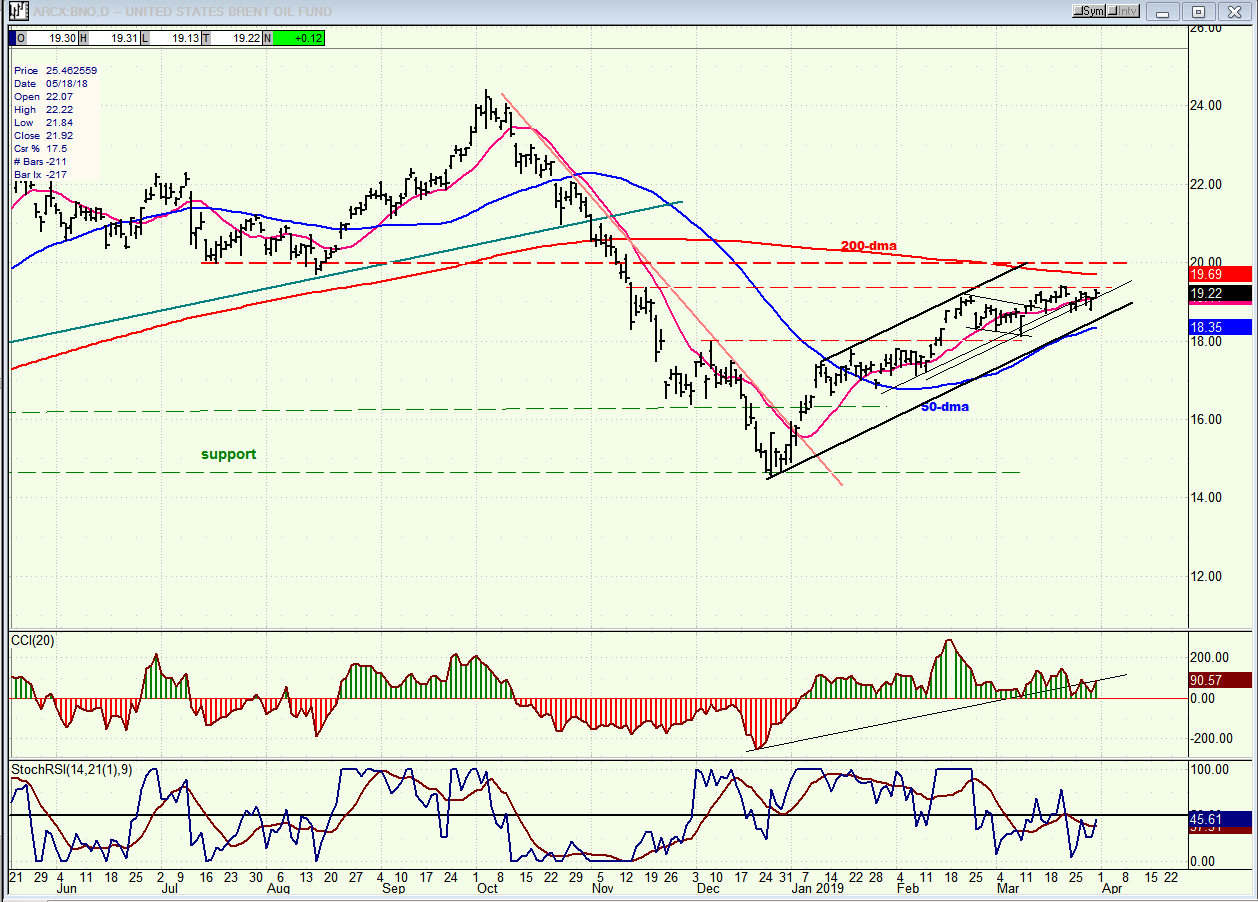
BNO (United States Brent Oil Fund) (daily)
BNO should have a little more to go before it runs into solid resistance. It is following the general market trend and should correct at the same time as the market.
Summary
SPX has been in an intermediate uptrend ever since its 2346 low, but that uptrend is showing deceleration which could result in a reversal in another two to three weeks.
FREE TRIAL SUBSCRIPTON
With a trial subscription, you will have access to the same information that is given to paid subscribers, but for a limited time period. I think you will find that ...
more

