Conference Board Leading Economic Index: "Economic Growth May Be Peaking"
The latest Conference Board Leading Economic Index (LEI) for December decreased fractionally to 111.7 from 111.8 in November. The Coincident Economic Index (CEI) came in at 105.1, up from 104.9 the previous month.
Please note that due to the government shutdown, data for manufacturers’ new orders for consumer goods and materials for November and December and building permits were not published for December. The Conference Board has forecasted these series in order to publish a preliminary Leading Economic Index. Data for manufacturers’ new orders for nondefense capital goods excluding aircraft for November are from the advance report for Manufacturers’ Shipments, Inventories & Orders. In addition, The Conference Board is postponing the regularly scheduled annual benchmark revision of the composite indicators until all underlying data are available.
The Conference Board LEI for the U.S. declined slightly in December, according to preliminary estimates. Large negative contributions from stock prices and the ISM® New Orders Index more than offset the large positive contribution from average weekly unemployment claims. In the second half of 2018, the leading economic index increased 1.5 percent (about a 3.1 percent annual rate), slower than the growth of 2.7 percent (about a 5.5 percent annual rate) during the first half of the last year. However, the strengths among the leading indicators remain more widespread that the weaknesses.
The Conference Board CEI for the U.S., a measure of current economic activity, increased in December. The coincident economic index rose 1.2 percent (about a 2.3 percent annual rate) between June and December 2018, slower than the growth of 1.0 percent (about a 2.0 percent annual rate) in the first half of 2018. However, the strengths among the coincident indicators have remained very widespread, with all components advancing over the past six months. The lagging economic index continued to increase, but at a faster rate than the CEI. As a result, the coincidentto-lagging ratio is down moderately. Real GDP expanded at a 3.4 percent annual rate in the third
quarter of 2018, after increasing 4.2 percent (annual rate) in the second quarter. [Full notes in PDF]
Here is a log-scale chart of the LEI series with documented recessions as identified by the NBER. The use of a log scale gives us a better sense of the relative sizes of peaks and troughs than a more conventional linear scale.
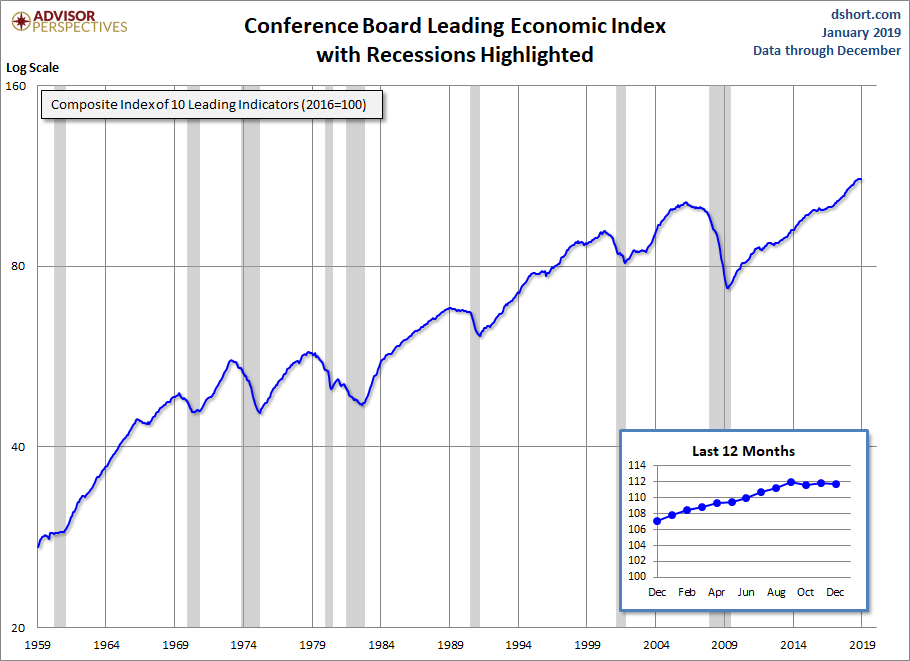
For additional perspective on this indicator, see the latest press release, which includes this overview:
“The US LEI declined slightly in December and the recent moderation in the LEI suggests that the US economic growth rate may slow down this year,” said Ataman Ozyildirim, Director of Economic Research at The Conference Board. “While the effects of the government shutdown are not yet reflected here, the LEI suggests that the economy could decelerate towards 2 percent growth by the end of 2019.”
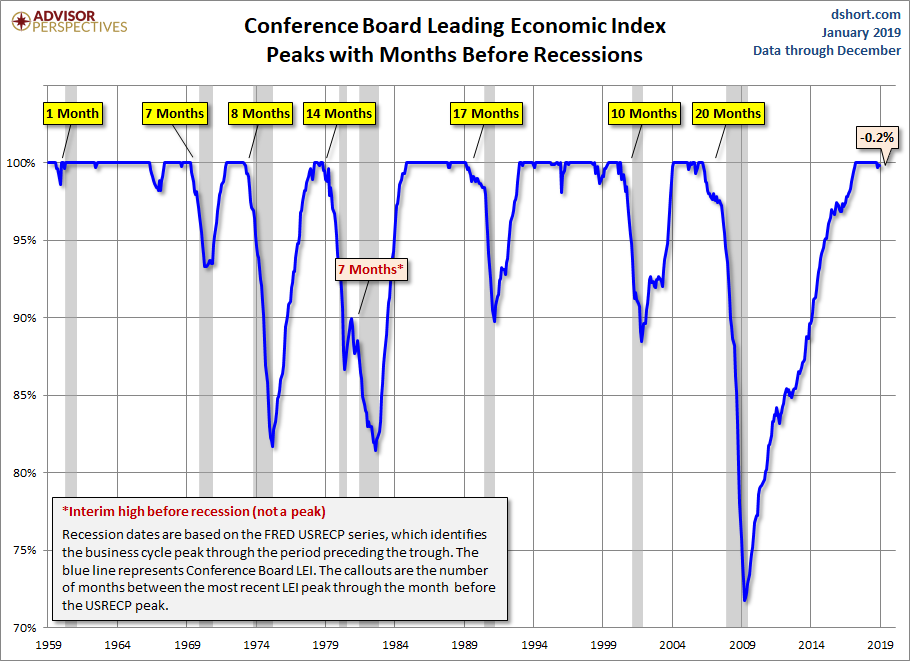
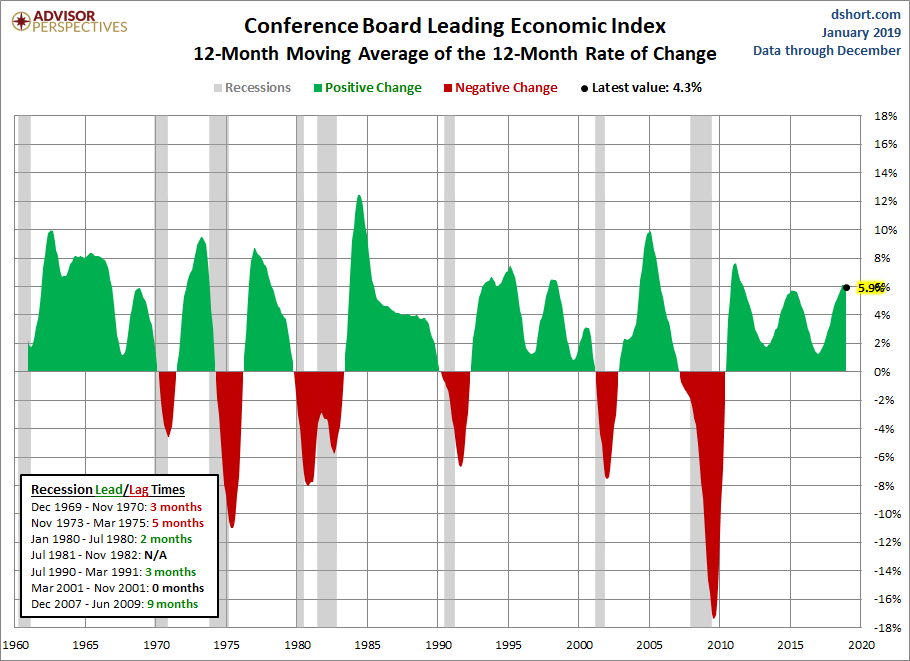
For a better understanding of the relationship between the LEI and recessions, the next chart shows the percentage-off the previous peak for the index and the number of months between the previous peak and official recessions.
LEI and Its Six-Month Smoothed Rate of Change
Based on suggestions from Neile Wolfe of Wells Fargo Advisors and Dwaine Van Vuuren of RecessionAlert, we can tighten the recession lead times for this indicator by plotting a smoothed six-month rate of change to further enhance our use of the Conference Board's LEI as a gauge of recession risk.
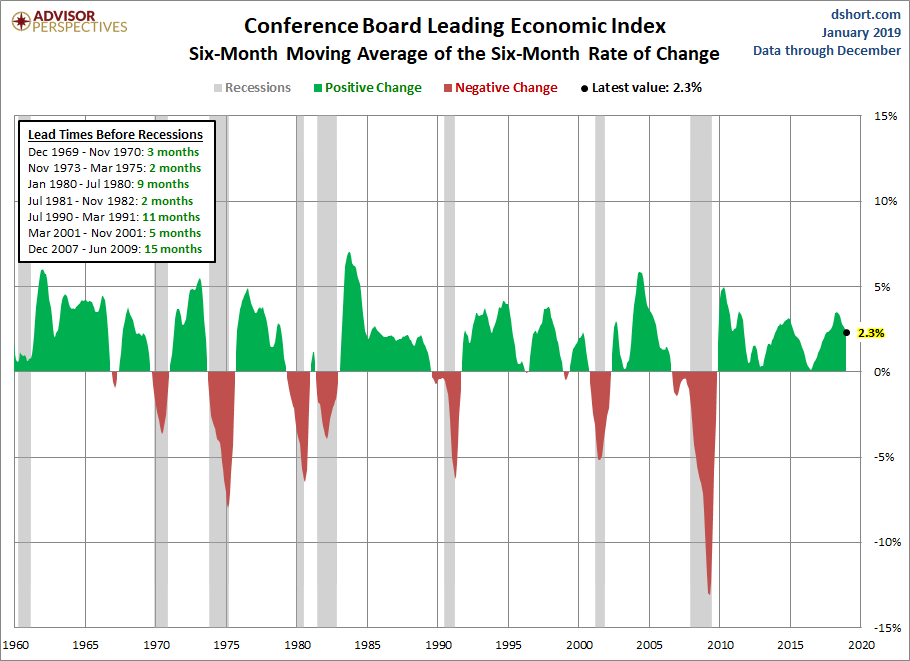
As we can see, the LEI has historically dropped below its six-month moving average anywhere between 2 to 15 months before a recession. The latest reading of this smoothed rate-of-change suggests no near-term recession risk. Here is a twelve month smoothed out version, which further eliminates the whipsaws:
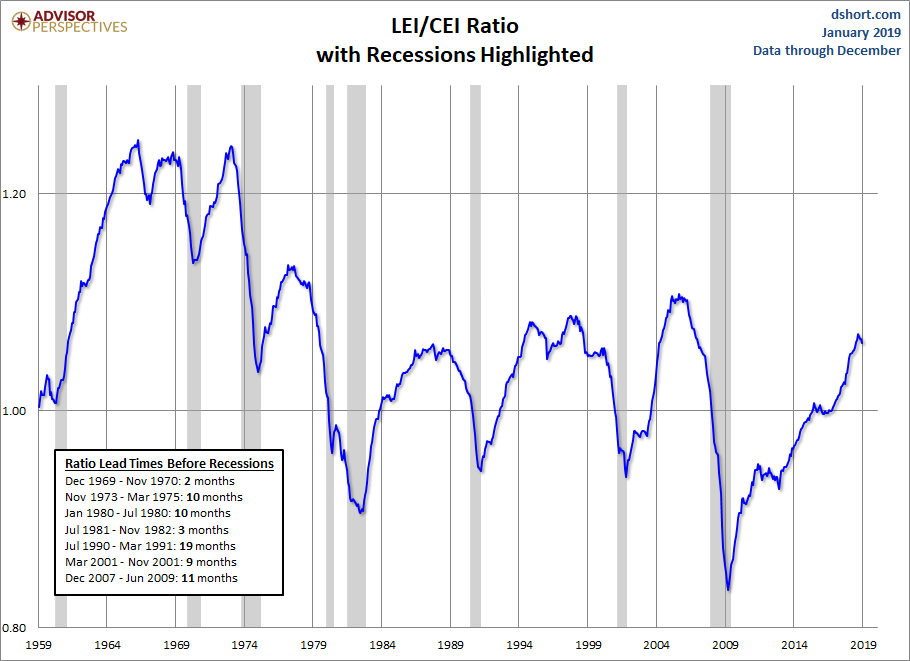
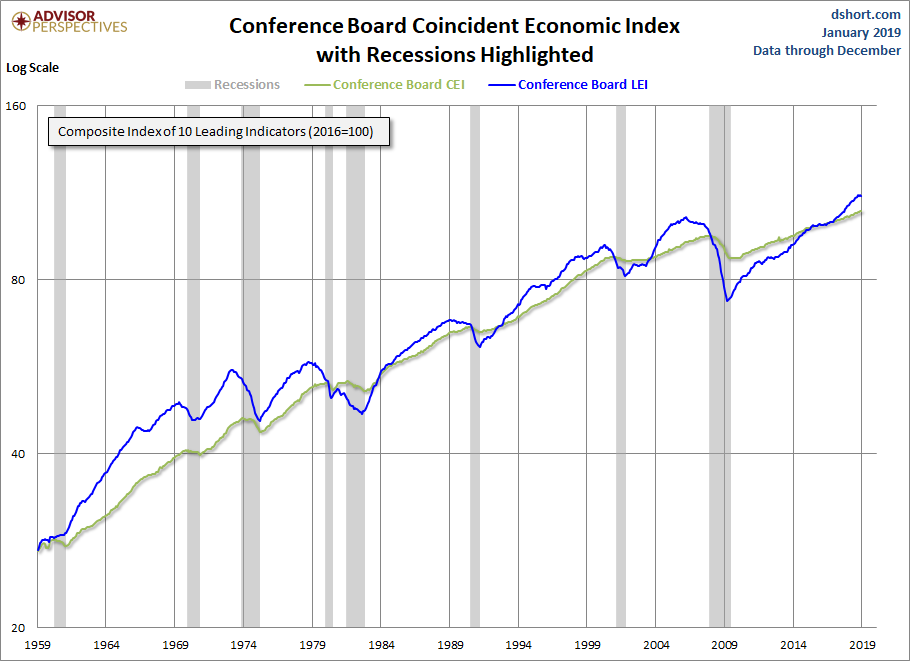
The Conference Board also includes its Coincident Economic Index (CEI) in each release. It measures current economic activity and is made up of four components: nonagricultural payroll, personal income less transfer payments, manufacturing and trade sales, and industrial production. Based on observations, when the LEI begins to decline, the CEI is still rising. Here's a chart including both the CEI and LEI.
Here is a chart of the LEI/CEI ratio, which is also a leading indicator of recessions.