
Comprehensive Geopolitical Picture Which May Prove To Impact All Forms Of Growth
The fears of profound losses to the equity markets in the event that tariffs have been increased were overblown… or were they? We wouldn’t let the sharp intraday reversal off the lows on Friday, which found the S&P 500 (SPX) finishing up nearly .40%, fool us into believing we’re out of the woods just yet. The S&P 500 ended the week 2.19% below its all-time high. The index began the week on the rise but ended down 2.18% from the previous Friday.
This past week marked the largest weekly drop for the S&P 500 since mid-March, when the benchmark index lost roughly 2.5% on heightened fears of a recession and with the 3-month and 10-year Treasury yields inverting. To that point, the two Treasury yields once again inverted this past week, but finished the week with a 2 bps spread. If a further market drawdown ensues in the coming week, expect another inversion and the rhetoric surrounding the potential for the clock to start ticking toward the next recession to become elevated in the analyst and media communities.
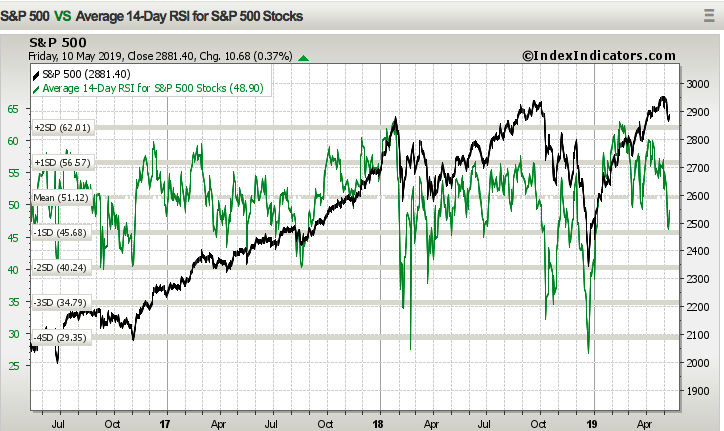
With the weekly decline across the major averages, the S&P 500 14-day RSI has also declined, showing broad weakness within the index and despite the strength in the market on Friday.
In addition to the declining relative strength of the S&P 500, all index ETFs have moved from overbought conditions to neutral condition in the past week. Only the Dow Jones Industrial Average (DJIA) index ETF (DIA) also finished the week below its 50-DMA as shown in the Bespoke table of index ETFs below:
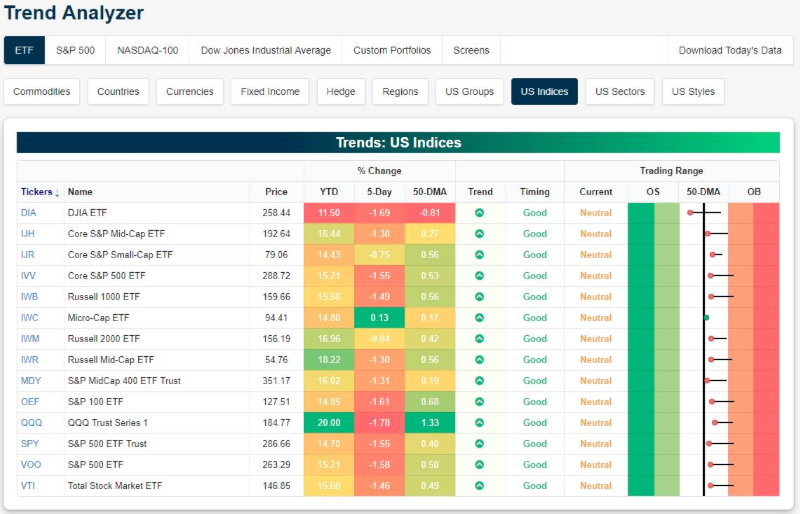
The S&P 500 itself, was a bit more fortunate, finishing about 20 points above its 50-DMA, with a strong late day rally in the index on Friday.
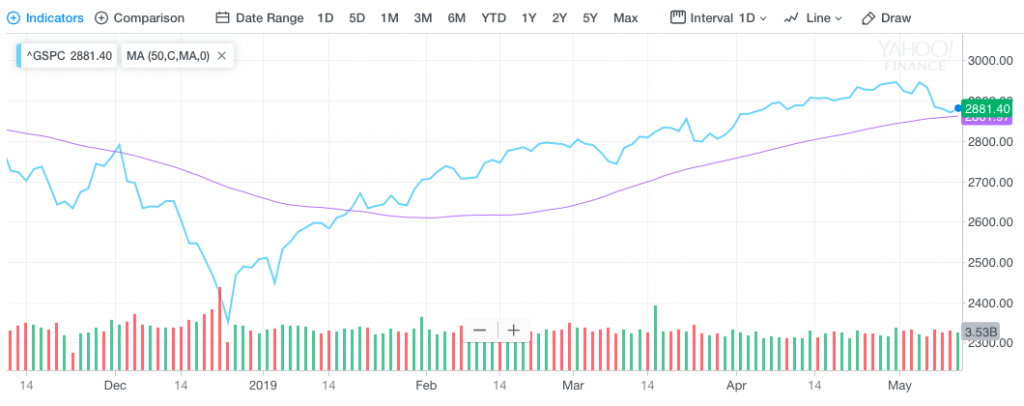
How important is the 50-DMA you might be asking? Finom Group (for whom I am employed) is of the opinion that technical moving averages are less relevant given how strong the YTD market rally has been. The rally was also blessed with a Breakaway and Zweig Breadth Thrust in mid-January, which tends to render technical analysis without efficacy for several months, as already witnessed this year. But that period of strength may have run its course and as such the moving averages may prove more noteworthy going forward.
It should also be noted that while the S&P 500 has rallied over the last several months and some 50 days since the last 2.5% drawdown, the percentage of S&P 500 stocks above their 50-DMA has been falling. The following chart (from Bullmarket.co) shows the S&P 500 advancers vs. decliners (top chart) compared to the S&P 500 itself (bottom chart).
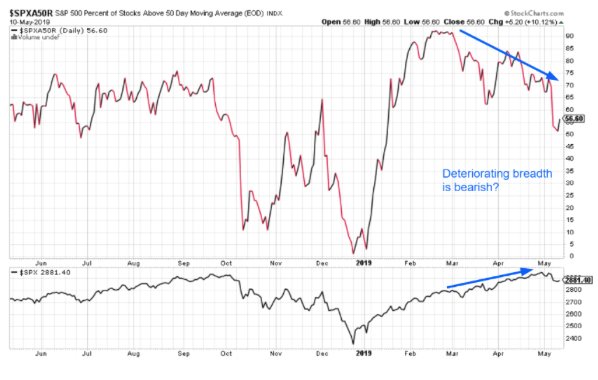
As we can clearly see, breadth divergence has been taking place since March and yet the S&P 500 continued higher, achieving a new record high level. So when you see people warn about breadth divergence, understand that this is not always the sign or reason for a market sell-off, as further evidenced in the table below from Bullmarkets.co:
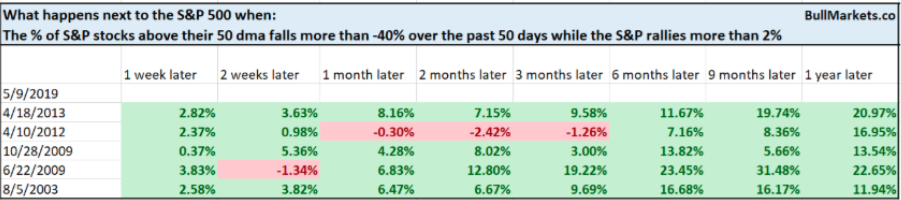
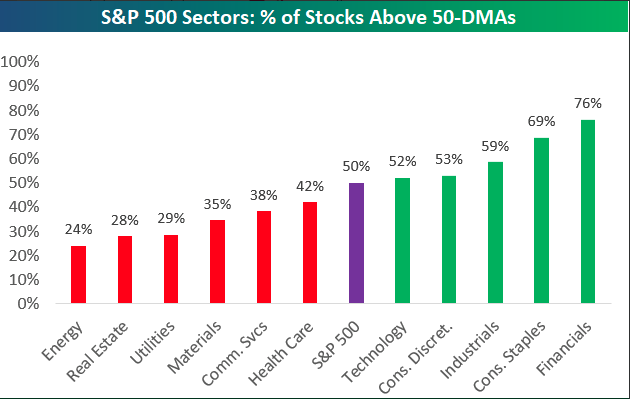
Narrowing the S&P 500 down by sectors, 6 of 11 sectors now have less than 50% of stocks trading above their 50-day moving averages.
We always focus on the macro-fundamentals because the economy and equity market are tied at the hip long-term, but we also pay attention to market breadth, technicals and sentiment because the market can have short-term fits and starts correlated to these variables. The stock market’s short term is always hard to predict. While the stock market’s short term was bearish over the past week, the short term is now neutral given the latest drawdown.
It does seem as though market participants believe there are now 2 “puts” backstopping the market from falling to the degree it had in Q4 2018. The first put is recognizably a more accommodative Fed, which is very unlikely to raise rates and will soon end the run-off of its balance sheet (QT). The second put comes by way of the President himself. Given the attention paid to the markets by the President and the seemingly timely, positive trade sentiment tweets on market declines, investors and algorithms seem to believe in a Presidential put of sorts. While this might seem illogical, the trend of positive Presidential tweet vs. market reaction is quite distinguishable. Speaking of the trade feud…
Trade Tariffs Raised-Alert
Before we discuss the heightened stakes surrounding the trade feud between the U.S. and China, we want to position this fund flows chart over the past 20 years to make an unmistakable point. (JPM chart)
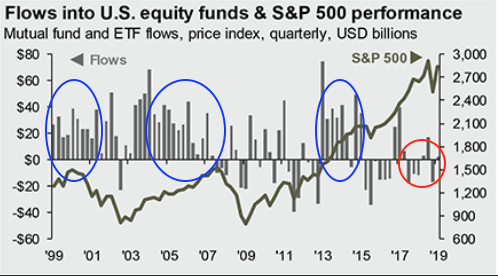
If you've never seen an indictment on an Administration, well now you have. The point should be very clear when we see the flows out of the market since the new White House Administration took hold in 2017. Almost entirely outflows over this period of time. Wall Street has essentially operated in a constant state of outflows or under the premise of exacting its disenfranchisement for the Administration. Wall Street participants could surmise this with a simple phrase, “Lack of trust”. Despite the rally since the 2016 election, investors have been piling out of the stock market. Does Wall Street have a reason to carry on with such sentiment for 3 years now? That’s for each investor to decide for himself or herself, but we think it a very unique situation that has been absent such outflows, which tend to follow recessions or macro-crises.
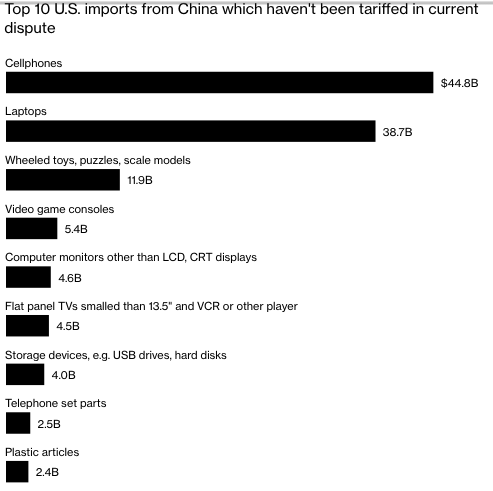
That leads us to our discussion on the “trade war”. As President Trump stated, on Friday tariffs for Chinese goods imported to the United States were raised from 10% to 25% and on the specified $200bn worth of goods. While this more than doubles the impact on U.S. wholesalers/importers, many have had ample time to source goods outside of China over the last 18 months. Given re-sourcing initiatives, some of the raised tariffs will have a lesser impact than many perceive. But make no mistake about it, the mere action of raising tariffs raises the temperature surrounding global trade, putting China’s economic output into question as it aims to rebound through the remainder of 2019. And don’t forget, the European Union is up to bat come May 18th as the U.S. deadline for it’s analysis on trade between the two regions aims to conclude with a decision of implementing tariffs… or not.
One thing has become clear though in these global trade feuds that have seemingly an origin with the current White House Administration, there’s no real way for investors to fully trust the Administration’s framing of trade negotiations. Can it really be that China tried to renegotiate terms? Surely it can, but here’s the reality of the situation. The U.S. is the World’s largest superpower in economic and military standards. It will and has done whatever it has desired to do to whomever it has desired to do so. Don’t believe us? Ask the folks who lived in Grenada, or those who lived in Iraq. Did we really have medical students in Grenada? How about those weapons of mass destruction? That’s the power of the United States and its President. We only know in hindsight of the falsehoods, only in hindsight it seems.
So the question remains, did China really try to renegotiate and eliminate items already within the framework of negotiations? U.S. negotiators have accused others of this as well, including Europe on whether agriculture will be included in the bilateral trade talks. So is everyone reneging with the U.S. or are the U.S. demands on trade simply out of bounds and overaggressive? Additionally, the question still remains; why raise the tariff level unless this is simply what the Administration desires to do, when it desires to do so?
We’ll have more to contemplate concerning U.S./China trade just ahead, but let’s take a look at what it really means when the U.S. President suggest that tariffs paid by the Chinese are a boon for our country in the following video:

The truth is that U.S. consumers are the end payer of tariffs as U.S. importers try to raise prices on goods to offset their costs from higher tariffs. What does this mean for you and I, the consumer? It all depends on how extreme the White House gets with protectionist policies. But Oxford Economics laid out various scenarios that, at the high end, could cost U.S. households as much as $800.
On the lower end, if the 25% tariffs that went into effect Friday are permanent and China retaliates, the U.S. economy could lose $62 billion in economic output by next year, according to Oxford Economics. That total translates to an equivalent loss of $490 per American household. Keep in mind, there has been no retaliation to speak of… yet!
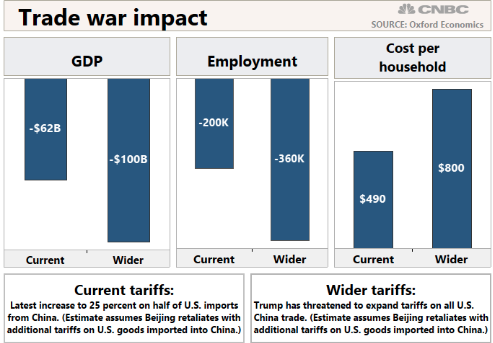
The job market could also take a hit thanks to trade turmoil. The current tariff rise could result in 200,000 fewer jobs, with growth falling below 2% in early 2020, according to Oxford Economics. The more extreme scenario with tariffs on all imports, and Chinese retaliation, would lead to 360,000 fewer jobs being created.
So what will happen next with U.S./China trade negotiations remains more muddied by the raising of tariffs. Simply put, if the first implementation of tariffs didn’t result in a deal, why would raising tariffs result in a deal? Because it would put pressure on the oppositional economy? Certainly that is one answer to the question, but a defiant and/or scorned “partner” lends itself to breaking treaties and agreements so… There’s just so little logic to negotiating and acting as the U.S. has other than the aforementioned, “We want to and we have right on our side. “ But right is quite subjective and I would presume China disagrees with what the U.S. understands to be right. Having said all of that, we have to consider the following:
- No true deal is likely to take place between the two parties and as such it will weigh on business sentiment through the entirety of the negotiating period.
- Should a trade deal take place it will be very limited and such a limited deal is unlikely to find tariffs removed as that is seen as the strength of oversight for even any small deal.
- China is willing and able to see itself putting on the robes of negotiators up to and through the 2020 U.S. elections in hopes of finding a new U.S. Administration for which to negotiate.
- Global trade will suffer and will likely impact the global economy further and dampen GDP growth domestically and abroad.
- U.S. uniformity in trading may push foreign governments to align, excluding the U.S. from any potential trade agreements.
- In the end, our stance on trade may prove to decouple the U.S. with its trading partners.
Investors are likely to be impacted early this coming trading week by more trade news. U.S. Trade Representative Robert Lighthizer said the administration would on Monday release details of its plans for tariffs on an additional $300 billion in imports from China, setting the process in motion for Trump to deliver on the threat to hammer all Chinese trade.
Securing a trade deal is likely to get harder from here unless outside factors, such as an economic downturn, force a compromise, according to Ely Ratner, a China expert who served in the administration of President Barack Obama and is now director of studies at the Center for a New American Security think-tank.
“The question is can the Chinese come back and offer enough such that Trump can sell it?’’ he said. “It is going to be hard for them to do that in the face of Trump escalating. I think it gets harder as this thing goes on, and it gets harder politically for Trump.’’
The timing of the latest escalation in the trade feud really couldn’t have come at a worse time, as equity markets have been rebounding around the globe along with Asia capital goods orders and regional PMIs.
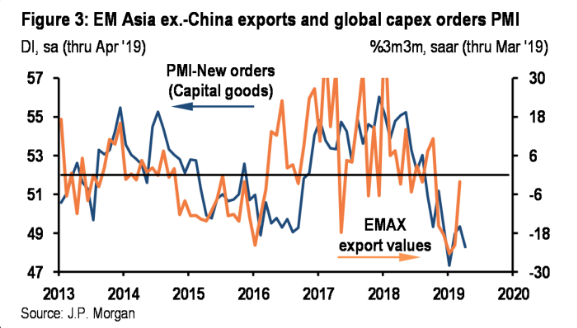
We would expect the recent rebound in Asia-Pacific trade to retrench and U.S. manufacturing to take a hit if the trade feud between the U.S. and China carries into the Q3 2019 period. This poses a risk to Finom Group’s modeled H2 2019 forecast.
Here’s what some strategists and analyst’s are saying, should an all out trade war take place, with both sides levying tariffs and walking away from further talks:
- This changes the thought process,” Daniel Gerard, head of investment and risk advisory for Asia Pacific in Singapore at State Street Bank & Trust Co., said in an interview with Bloomberg TV. “If this continues this changes our decision from being pro-late cycle -- a growth story -- into a more defensive case.”
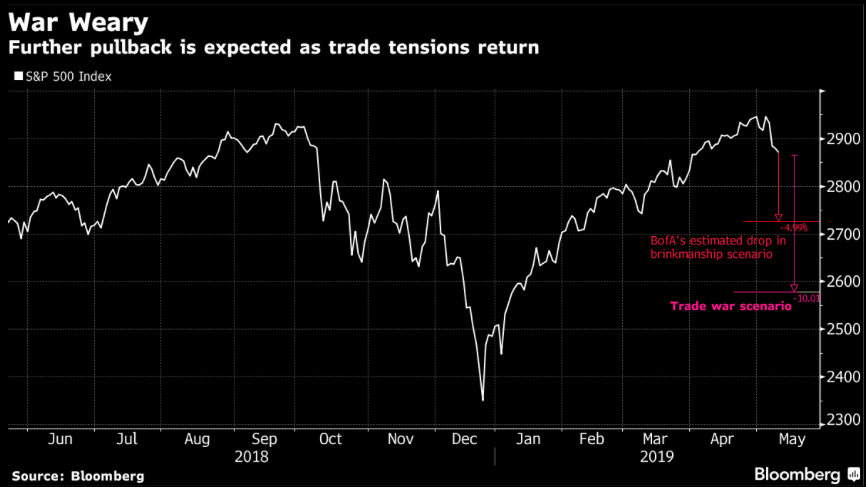
- Bank of America Corp. estimates the S&P 500 could tumble 5% if the brinkmanship intensifies, paying the way for extended volatility. The indirect damage -- delayed investment -- would be greater than the near-term impact on earnings, it reckons.
- Miller Tabak + Co.’s Matt Maley is keeping his eyes glued on the technical levels. If one breaks, then the S&P 500 could be headed even lower to the next stop. The result? A minimum of a 7% pullback.
- JPMorgan Chase & Co.’s chief U.S. economist, Michael Feroli, estimates a higher tariff rate of 25% could reduce 2019 GDP growth by about two-tenths of a percentage point. While that may seem muted, it could be worse for stocks.
- Most economists agree that the trade war is likely to have limited impact on global economic growth, but a large impact on company earnings,” said Dennis Debusschere, head of portfolio strategy at Evercore ISI. “We wouldn’t take comfort in the idea that a limited impact on economic growth would also limit the downside risk to equities. If tariffs are increased at 12:01 AM Friday, the decline in risk assets is likely to intensify and we would not take comfort that it would take two weeks for tariffs to have an impact. The signal of continued escalation is what’s important.”
Have you ever hard the saying “Never enter a war on someone else’s land?” The reference is suggested because of the simple fact that a war is generally only considered won if nobody is left standing to claim otherwise. Wars simply don’t end that way. Trade wars are much the same as land invasion wars in that nobody truly wins. Governments don’t pay the price for trade wars, citizens do. To the extent that there is something to gain from a trade war it is unlikely to be realized for decades to come.
In closing out this segment of this weekly report we think investors are moving to a more defensive posture in the coming trading weeks, lowering the beta profile of their portfolio while allowing for daily weekly trading activity via a heavy cash position. Simply put, while the market may have only exacted a 2.18% pullback this past week, the economic data and analyst communities may exact a greater pullback in the weeks to come and as they revise their outlook for 2019.
Having said that, should the market lean more aggressively on the thesis of the “2 puts”, this will be realized by traders through the markets recapturing former highs rather quickly. Should the S&P 500 recapture its former highs, it will likely trade to 3,000, which will find traders piling into the equity ETFs to capture such gains with limited risk. Momentum begets momentum.
Weekly Economic Data
As noted previous, the week that was didn’t provide a great deal of economic data and that which was provided was of little consequence. Additionally, most investors were highly tuned toward whether or not tariffs would be raised on Friday morning. We know the answer to that now! Having said that the JOLTS survey surged higher from a March reading of 7.1mm to an April reading of 7.5mm. The labor market continues to be the strength of the U.S. economy and has provided improved wage growth for millions of Americans employed.
In addition to the latest JOLTS survey, our reads on inflation continue to show themselves tempered. The consumer price index rose 0.3% in April, the government said Friday. Economists polled by MarketWatch had forecast a 0.4% advance.
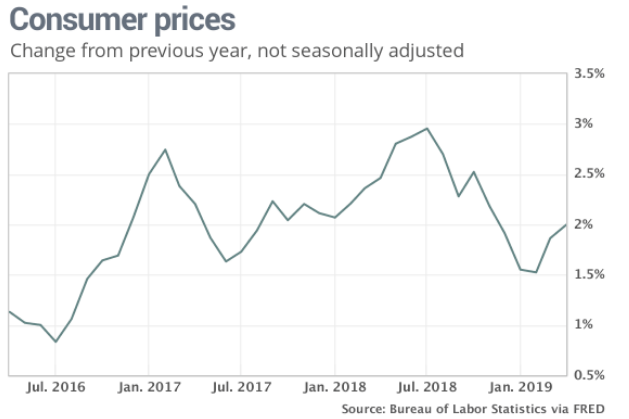
The increase in the cost of living over the past 12 months edged up to 2% from 1.9%. That’s the highest rate of inflation since November, but well below last year’s peak of 2.9%.
Another closely watched measure of inflation that strips out food and energy rose a scant 0.1% for the third month in a row.
- Gas prices rose a seasonally adjusted 5.7% last month, accounting for two-thirds of the increase in overall consumer price index.
- Rents rose 0.4%. In the past 12 months, rents have climbed 3.8% to mark the fastest increase in a year and a half.
- The increase in those costs was partly offset by a small decline in food prices — the first drop since the summer of 2017. The cost of every major grocery category fell except for dairy.
- Used vehicles were cheaper.
- The cost of clothing dropped 0.9%, the second straight big decline. The government changed how it calculates the cost of clothes, and economists say the latest figures should be treated with caution until more data is collected.
There were a good many FOMC members that weighed in on the economy this past week, but their comments would swiftly be pointed toward trade and the possibility of a rate cut. Atlanta Fed President Raphael Bostic said Friday the central bank might have to cut interest rates if consumer spending suffers as a result of the new round of tariffs placed on Chinese goods.
“The consumer has not really seen the full effect of any of the tariffs to date.
The first round of tariffs... most businesses, that we talked to, said ‘we did not pass through most of that elevated costs through to the final customer. But as tariffs get applied to a broader set of goods and the degree of the tariff goes up, businesses have told Fed staffers that “it is harder to forbear” from passing along prices to consumers.
We [at the Fed] just have to be nimble, we have to be ready, we have to be alert and we have to be smart in a quick way to try to understand” what changes are occurring in underlying economic conditions.”
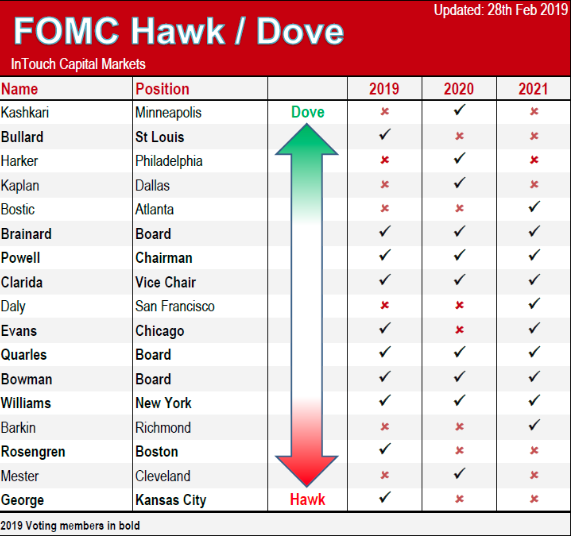
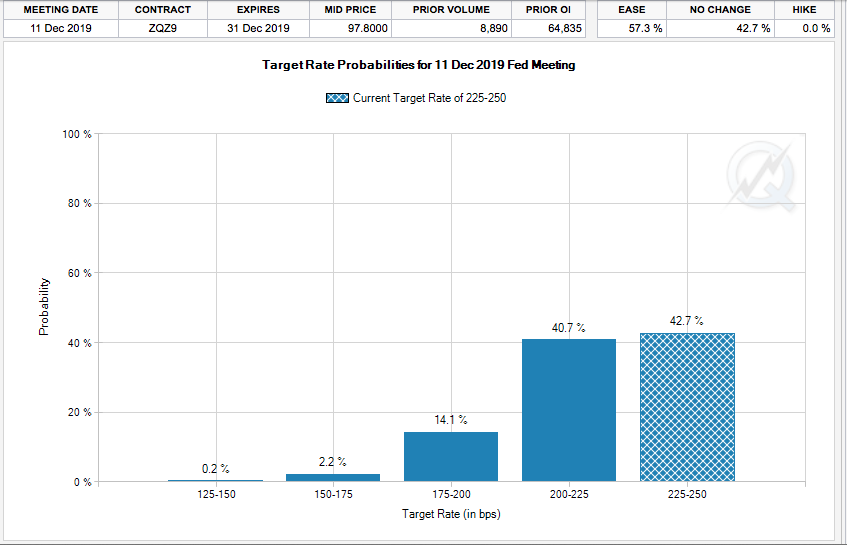
Keeping in mind that Bostic is not a voting member this year, the market is still pricing in a Fed rate cut by December 2019. As of Friday’s market close, investors are pricing in just under a 60% probability of a Fed rate cut by December and according to the CME FedWatch Tool.
In the coming week, the pace of relevant economic data picks back up. The NFIB small business index is due out Tuesday and followed by monthly retail sales on Wednesday. (MarketWatch Economic Data Table)
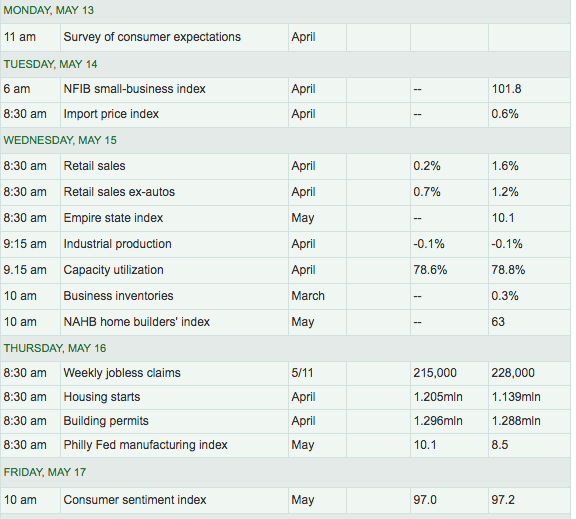
Later on Wednesday, investors will receive the latest NAHB homebuilder’s index, which will lead into Thursday’s release of Housing Starts and Building Permits data. Then we’ll get the latest reading on manufacturing through the Philly Fed manufacturing index.
Fund Flows
Unfortunately, the latest Lipper Weekly FundFlows report proved unfavorable. While 6 of the previous 7 weeks showed signs of inflow strength with regards to equity ETF’s investors began to once again offload equities.
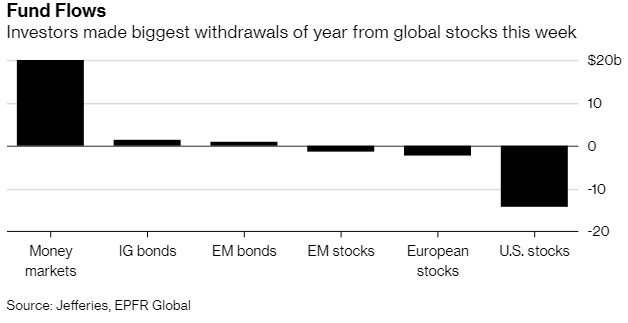
The ETF universe suffered net outflows of $11.6 billion, its worst weekly net negative flow since the fund-flows week ended January 30, 2019 (-$14.7 billion). Equity ETFs (-$10.4 billion) accounted for the lion’s share of this week’s net outflows and it was also their worst week since January 30 (-$14.6 billion). SPDR S&P 500 ETF (SPY, -$7.3 billion) and Invesco QQQ Trust (QQQ, -$2.5 billion) were responsible for the majority of the net outflows among equity ETFs. Taxable bond ETFs (-$1.4 billion) also saw money leave their coffers last week. The largest net negative flows for this group belonged to iShares 20+ Years Treasury Bond ETF (TLT, -$871 million) and SPDR Bloomberg Barclays High Yield Bond ETF (JNK, -$654 million). Muni debt ETFs experienced their fifth straight weekly net inflows as the group took in $237 million in net new money.
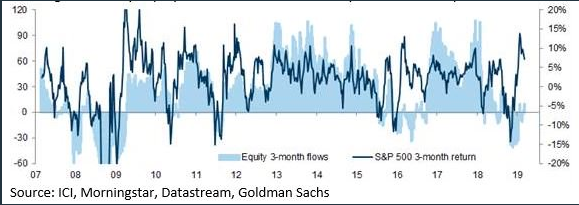
Historically, equity fund flows have been closely correlated with market performance. Not this time around. The recent divergence is one of the largest since the Great Financial Crisis.
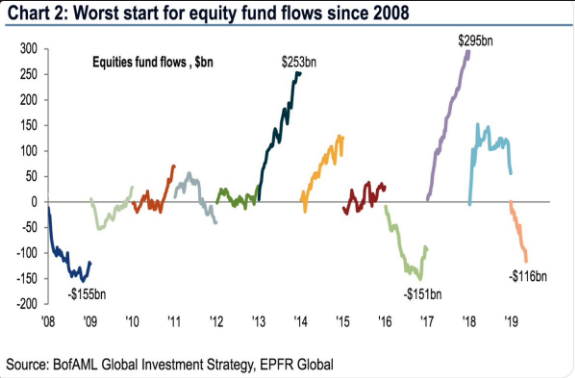
And yes, for certain this is the worst year of fund flows since 2008.
Volatile Week
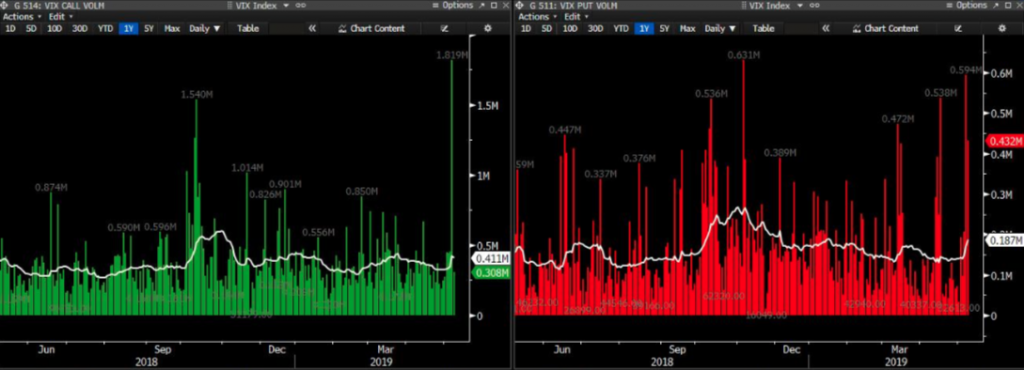
As the title subject recognizes, the past trading week saw a good deal of volatility with implied and realized volatility moving higher. The VIX rose above 23 at one point while the S&P 500 broke down below 2,830 briefly. The rise in the VIX to 23 was greater than 10 points from the previous week. It found many noncommercial VIX futures shorts covering positions.
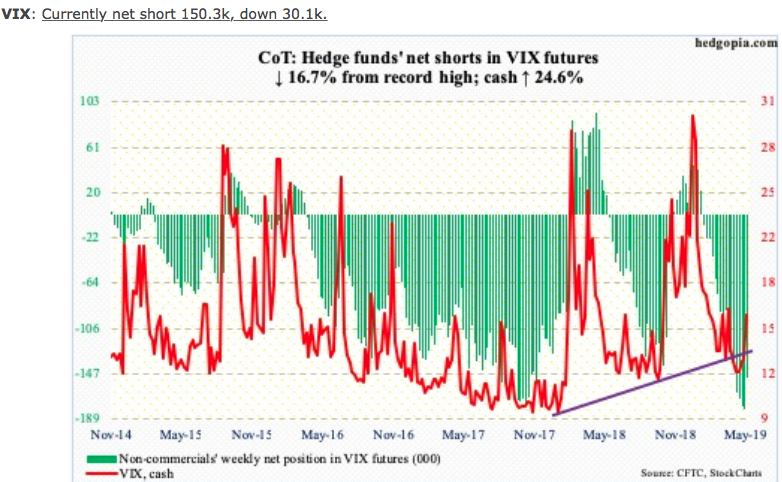
Non-commercials this past week cut back their record net shorts by roughly 16% on the week. While a tumultuous week it proved to be, with several bouts of intraday volatility, the VIX fell significantly on Friday, from just over 19 to finish the week at 16.04, down 16% on Friday.
VIX call volume soared this past week and the Volatility of Volatility Index (VVIX) ran higher in accordance with the volume. VVIX hit 117.46 at its peak before plunging to 96 at the end of the week.
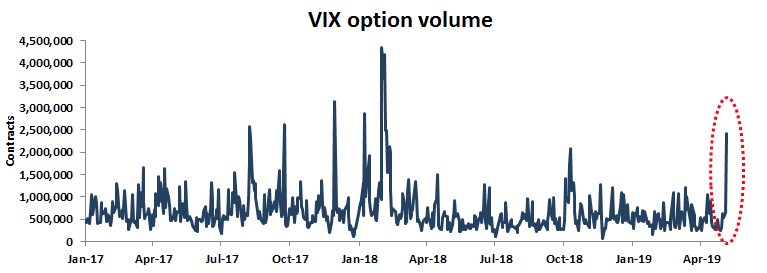
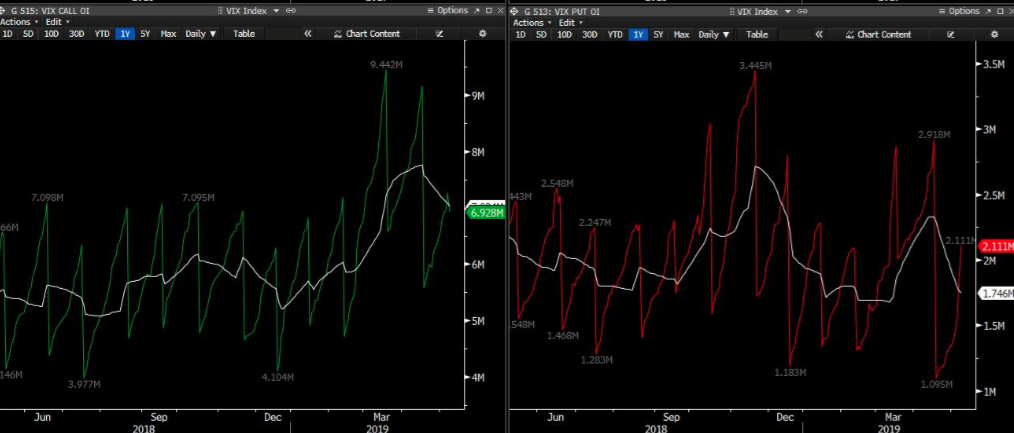
Additionally, despite the largest VIX call volume since Volmageddon, traders used the spike to take calls off the table, confirmed by declining call open interest (OI). Compare this to puts, where tons of ratios/spreads have been bought to play a crush in the VIX in the coming weeks with OI increasing over 600k this week. VOL sellers have long since known the disproportionate and underwater long-VOL positioning that has taken place in 2019. For each spike in VOL they are improving upon their positions.
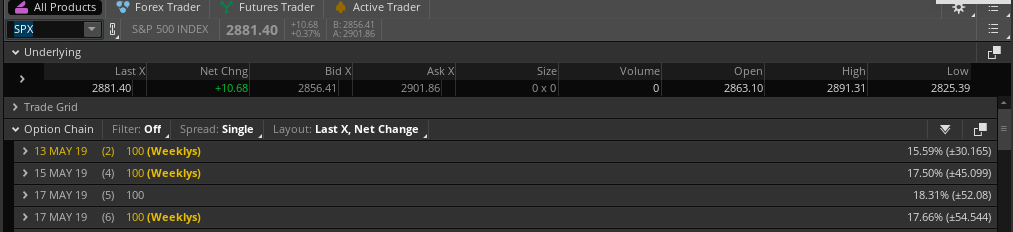
With the VIX spiking this past week, we naturally see that the S&P 500 weekly expected move for the coming week has also risen substantially. Remember, a VIX at 16 suggests daily 1% moves from the S&P 500 folks. 2019 has provided investors with the fewest 1% moves through the first 5 months of the year since 1995, which may soon prove to change.

Last week the weekly expected move was nearly doubled to the lower bound of the expected move. With that being said, the weekly expected move for the coming week is $54/points.
Q1 Earnings Outlook
This coming week represents a winding down of earnings season and with monthly retail sales set to be reported. As such, it would only be fitting that some big name retailers will also be found reporting quarterly results this coming week.
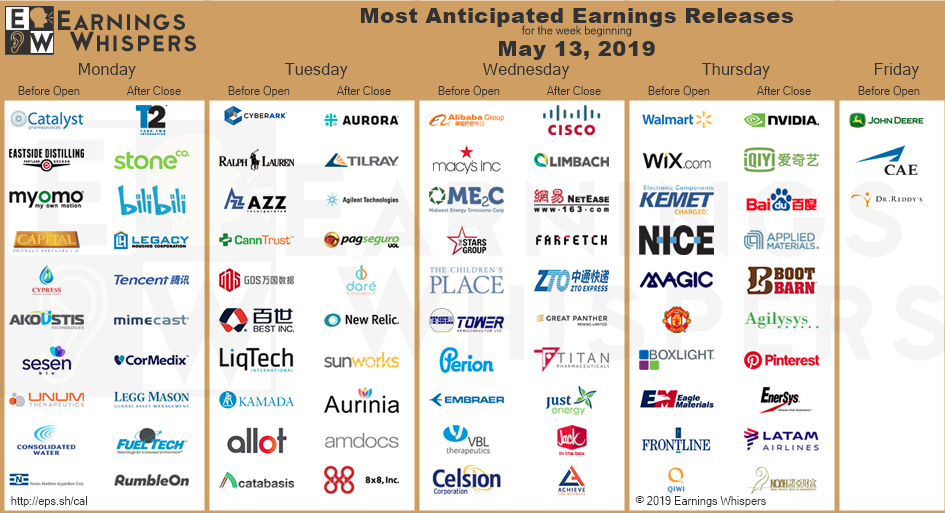
Macy’s (M) and Wal-Mart (WMT) will report results Wednesday and Thursday respectively while some of the anticipated results from Cisco (CSCO) and Nvidia (NVDA) will also be delivered. While we expect certain of these quarterly reports to beat analysts’ expectations, that would be in keeping with the totality of the earnings season theme, that defied the feared and heralded “earnings recession”.
In their latest earnings update FactSet is found once again upwardly revising their Q1 2019 Earnings and sales forecasts. As outlined in the past, this would prove inevitable as the beat rate was forecast to be greater than previous quarters and years, largely due to greater downward revisions to forecasts by the analyst community since Q4 2018.
On March 31, the estimated earnings decline for Q1 2019 was -4.3 percent. For Q1 2019 (with 90% of the companies in the S&P 500 reporting actual results for the quarter), 76% of S&P 500 companies have reported a positive EPS surprise and 59% have reported a positive revenue surprise. For Q1 2019, the blended earnings decline for the S&P 500 is -0.5 percent. If -0.5% is the actual decline for the quarter, it will mark the first year-over-year decline in earnings for the index since Q2 2016 (-3.2%). The forward 12-month P/E ratio for the S&P 500 is 16.5. This P/E ratio is equal to the 5-year average (16.5) but above the 10-year average (14.7).
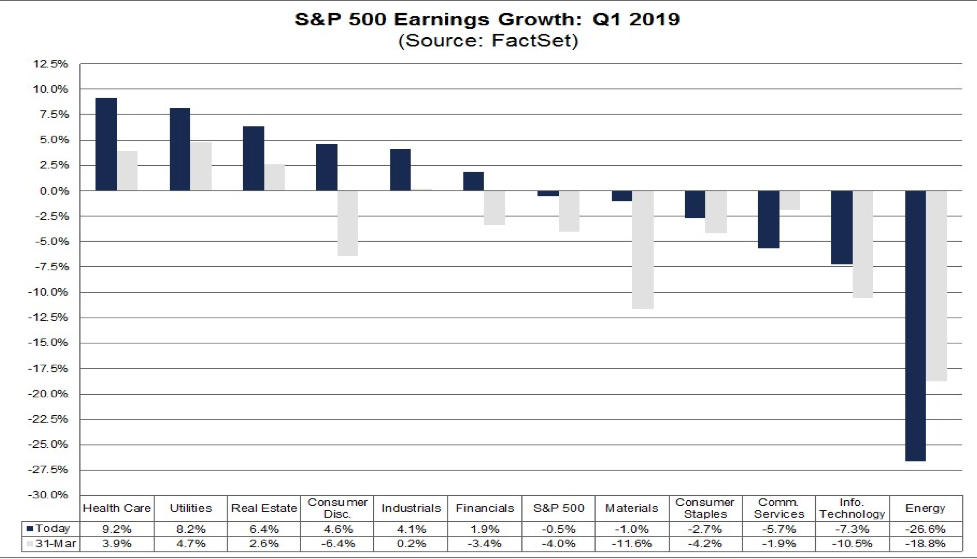
According to FactSet, the blended revenue growth rate for Q1 2019 is 5.3% today, which is slightly above the revenue growth rate of 5.2% last week. Positive revenue surprises reported by companies in the Financial sector were mainly responsible for the slight increase in the overall revenue growth rate during the week. If 5.3% is the final growth rate for the quarter, it will tie the mark for the lowest revenue growth rate for the index since Q2 2017 (also 5.3%).
Despite the stronger than anticipated Q1 2019 earnings season, FactSet still forecasts an earnings recession in the Q2 period and offers its forecast for the remaining quarters and full year as follows:
- For Q2 2019, analysts are projecting a decline in earnings of -1.7% and revenue growth of 4.3%.
- For Q3 2019, analysts are projecting earnings growth of 0.6% and revenue growth of 4.3%.
- For Q4 2019, analysts are projecting earnings growth of 7.4% and revenue growth of 4.6%.
- For CY 2019, analysts are projecting earnings growth of 3.3% and revenue growth of 4.7%.
With FactSet’s forecast in the rear view mirror, we now turn our attention to the more optimistic and usually more accurate Reuters/Lipper Insights/Refinitiv earnings forecast and outlook for Q2 2019 earnings.
Aggregate Estimates and Revisions:
- First quarter earnings are expected to gain 1.3% from 18Q1. Excluding the energy sector, the earnings growth estimate is 2.7%.
- Of the 448 companies in the S&P 500 that have reported earnings to date for 19Q1, 75.4% have reported earnings above analyst expectations. This compares to a long-term average of 65% and prior four quarter average of 76%.
- 19Q1 quarter revenue is expected to increase 5.6% from 18Q1. Excluding the energy sector, the revenue growth estimate is 6.2%.
- 56.9% of companies have reported 19Q1 revenue above analyst expectations. This compares to a long-term average of 60% and prior four quarter average of 67%.
- During the week of May 13, 9 S&P 500 companies are expected to report earnings.
Reuter’s outlook for the estimated earnings growth rate for the S&P 500 in 19Q2 is 1.2 percent. If the energy sector is excluded, the growth rate improves to 1.3%. The S&P 500 expects to see share-weighted earnings of $336.7B in 19Q2, compared to share-weighted earnings of $332.6B (based on the year-ago earnings of the current 505 constituents) in 18Q2.
Investor Takeaways
While the S&P 500 fell 2.18% last week, investors and strategists feared a far worse decline. This does not exonerate declines in the coming weeks, but it does suggest that investors remain optimistic that a trade deal of sorts will be reached or that more tariffs on an additional $300bn in goods will not be levied. Additionally, investors may be taking solace in the notion that the FOMC and/or President may desire to support the economy and stock market should either falter, by cutting rates and/or retracting certain tariffs in favor of a trade deal. Either way Finom Group always recommends focusing on fundamentals i.e. valuation, earnings, and economic risk that would otherwise effect said earnings. These all remain attractive for long-term investors who ignore the emotional ebbs and flows of the market on any given day.
While we can contemplate the impacts from tariffs all day, the reality is there are vast workarounds that always take place once tariffs are levied. We will likely continue to see increased Chinese exports to EU, Japan, Korea, etc. In 1990s, when U.S. tariffs on Japan reduced U.S. imports, one-third to one-quarter of that trade was deflected/re-routed to the EU.
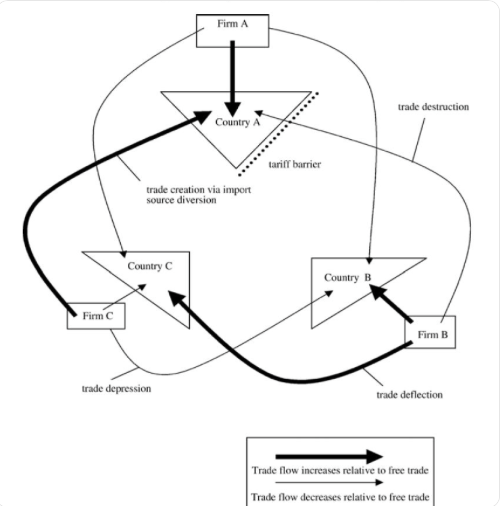
We already see many firms deflecting exports from China to Vietnam, Cambodia and Indonesia. This is showing up in Chinese export data. Chinese exports dropped 13.1% in April compared to a year ago. China also bought less from the U.S. as imports fell by 25.7% in the same period, Bloomberg data showed. However these workarounds and deflecting of duties take place, the negative sentiment amongst the business community still pervades economic growth potential; weighing it down over time.
When we take the confluence of factors presiding over the 2019 rally and recent pullback we are found to understand that the market is lacking fund flows and the typical equity exposure percentile amongst the investor communities. Additionally, defensive sectors have outperformed cyclical sectors, showing defensive posturing throughout the market’s rebound. These are not the signs of market conviction and should not be taken lightly by those whom choose to invest. While the U.S. economic data has been strengthening, much of that data is in hindsight and investors are likely going to demand more data post the recent escalation of tariffs to prove out economic impacts before improving their equity exposure. That scenario likely leaves U.S. corporates as the largest buyer of equities through the Q2 period.
While the market rebounded on Friday, it should also be noted that such rebounds are usually retraced, as the market likes to revisit “the scene of the crime” for support. The potential for the market to retrace its steps back below the 50-DMA looms large presently… unless a close above 2,900 is found first and without investor fallout from renewed trade headlines. Having said that, we fully expect large intraday market declines to be met with positive, Presidential trade tweets as a backstop/support for markets. Such tweets may wear thin over time for which the FOMC will be called upon to cut rates.


