
Comparing Recent U.S. Presidents: New Debt Added Vs. Precious Metals Production
Recent U.S. Presidents: Debt vs. Coins Added
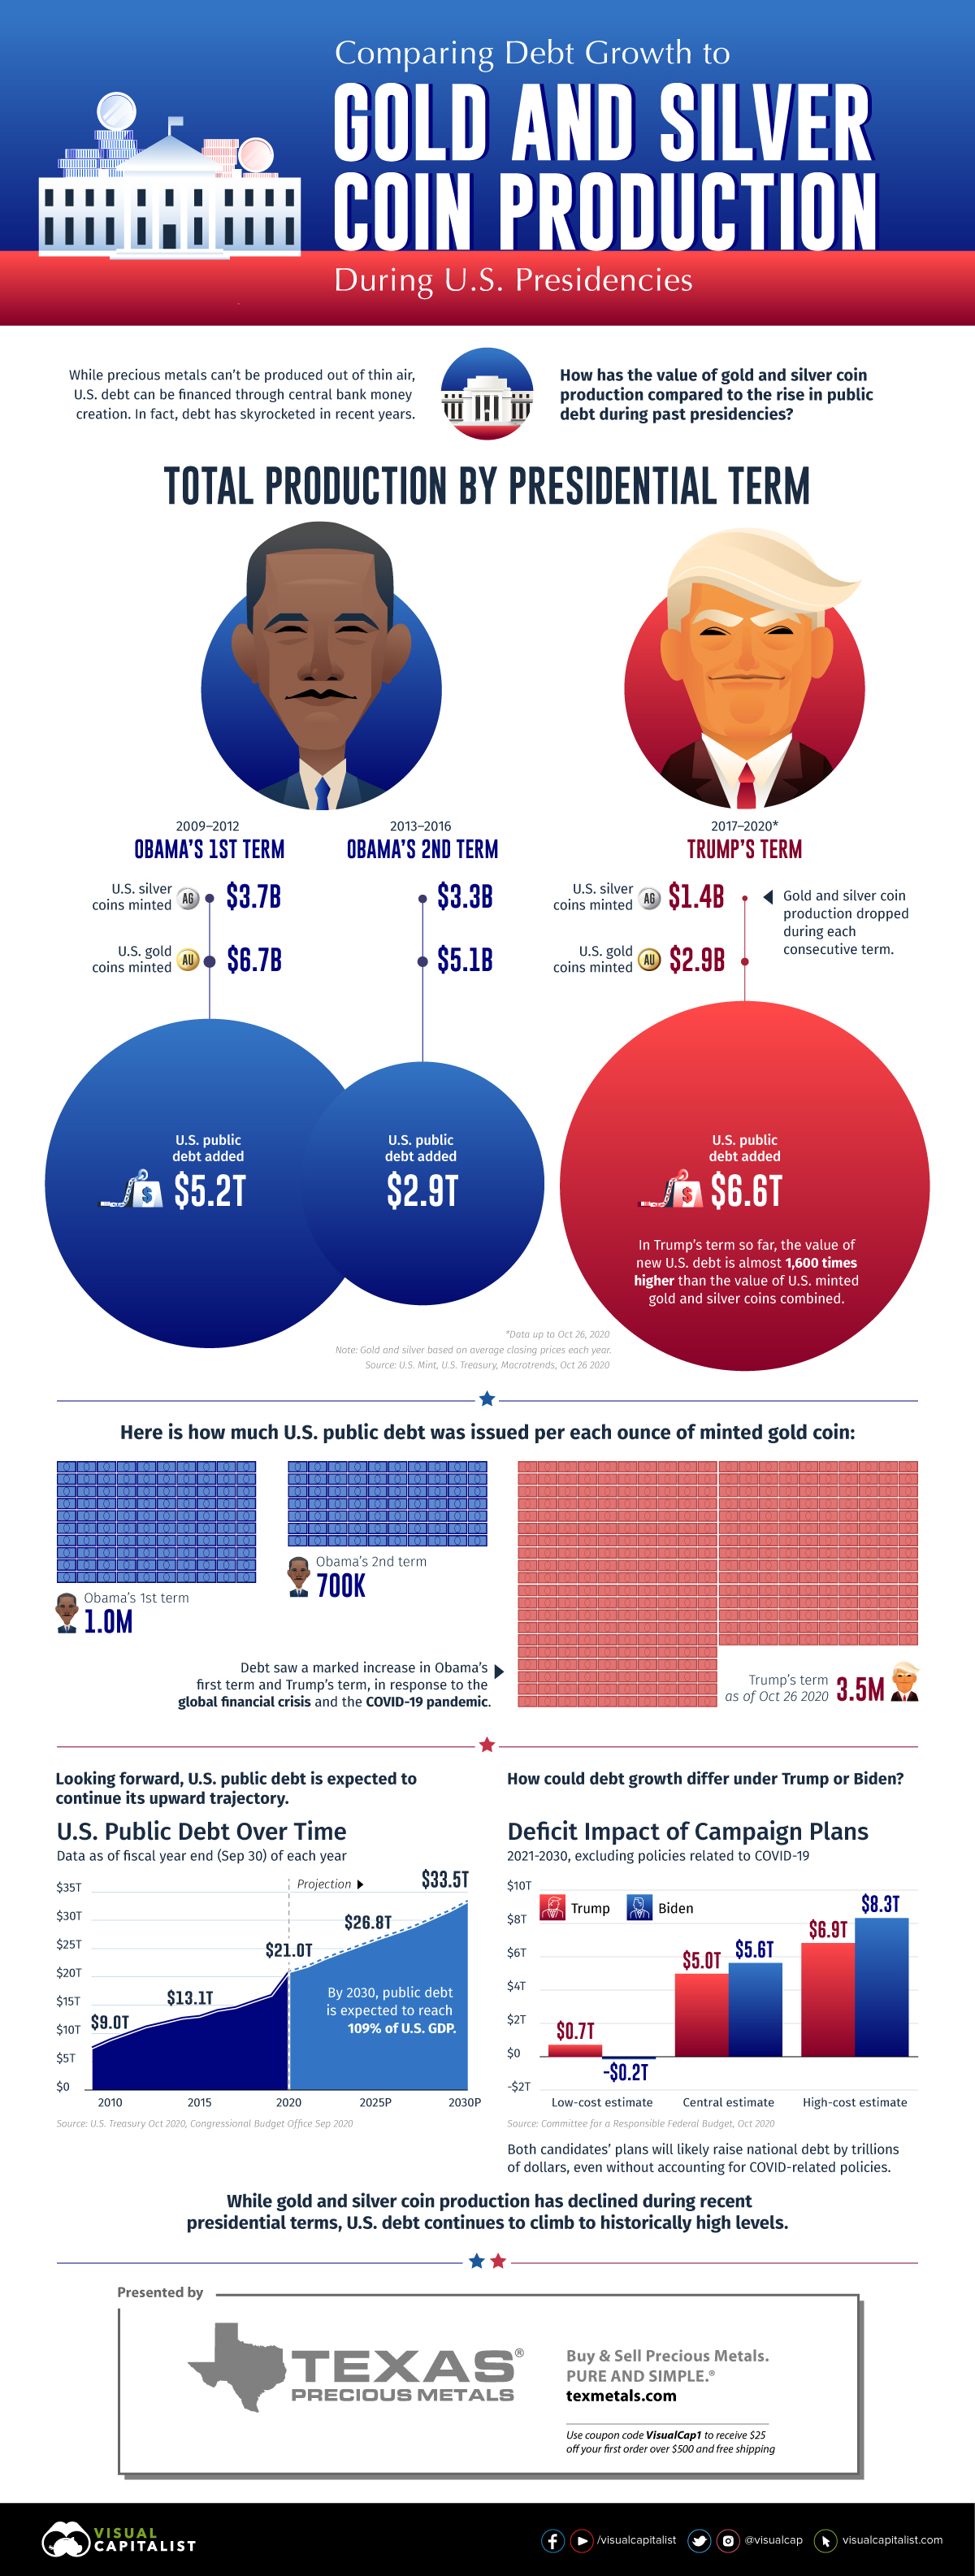
While precious metals can’t be produced out of thin air, U.S. debt can be financed through central bank money creation. In fact, U.S. debt has skyrocketed in recent years under both Democrat and Republican administrations.
This infographic from Texas Precious Metals compares the increase in public debt to the value of gold and silver coin production during U.S. presidencies.
Total Production by Presidential Term
We used U.S. public debt in our calculations, a measure of debt owed to third parties such as foreign governments, corporations, and individuals while excluding intragovernmental holdings. To derive the value of U.S. minted gold and silver coins, we multiplied new ounces produced by the average closing price of gold or silver in each respective year.
Here’s how debt growth stacks up against gold and silver coin production during recent U.S. presidencies:
| Obama's 1st term (2009-2012) | Obama's Second Term (2013-2016) | Trump's term (2017-Oct 26 2020) | |
|---|---|---|---|
| U.S. Silver Coins Minted | $3.7B | $3.3B | $1.4B |
| U.S. Gold Coins Minted | $6.7B | $5.1B | $2.9B |
| U.S. Public Debt Added | $5.2T | $2.9T | $6.6T |
Over each consecutive term, gold and silver coin production decreased. In Trump’s term so far, the value of public debt added to the system is almost 1,600 times higher than minted gold and silver coins combined.
During Obama’s first term and Trump’s term, debt saw a marked increase as the administrations provided fiscal stimulus in response to the global financial crisis and the COVID-19 pandemic. As we begin to recover from COVID-19, what might debt growth look like going forward?
U.S. Public Debt Projections
As of September 30, 2020, the end of the federal government’s fiscal year, debt had reached $21 trillion. According to estimates from the Congressional Budget Office, it’s projected to rise steadily in the future.
| 2021P | 2022P | 2023P | 2024P | 2025P | 2026P | 2027P | 2028P | 2029P | 2030P | |
|---|---|---|---|---|---|---|---|---|---|---|
| U.S. Public Debt | 21.9T | 23.3T | 24.5T | 25.7T | 26.8T | 27.9T | 29.0T | 30.4T | 31.8T | 33.5T |
| Debt-to-GDP ratio | 104.4% | 105.6% | 106.7% | 107.1% | 107.2% | 106.7% | 106.3% | 106.8% | 107.4% | 108.9% |
By 2030, debt will have risen by over $12 trillion from 2020 levels and the debt-to-GDP ratio will be almost 109%.
It’s worth noting that debt will likely grow substantially regardless of who is elected in the 2020 U.S. election. Central estimates by the Committee for a Responsible Federal Budget show debt rising by $5 trillion under Trump and $5.6 trillion under Biden through 2030. These estimates exclude any COVID-19 relief policies.
What Could This Mean for Investors?
As the U.S. Federal Reserve creates more money to finance rising government debt, inflation could eventually be pushed higher. This could affect the value of the U.S. dollar.
On the flip side, gold and silver have a limited supply and coin production has decreased over the last three presidential terms. Both can act as an inflation hedge while playing a role in wealth preservation.
Disclosure: None


