
Commodities Led Most Asset Classes Higher Last Week
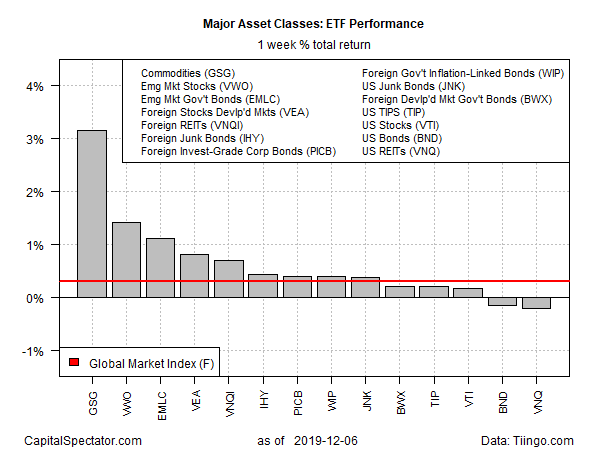
Breaking a three-week losing streak, broadly defined commodities topped last week’s returns for the major asset classes, based on a set of exchange-traded funds. Other than US bonds and real estate investment trusts (REITs), all the primary slices of global markets posted gains for the trading week through Friday, Dec. 6.
The iShares S&P GSCI Commodity-Indexed Trust (GSG) rose 3.2%, the fund’s first weekly advance since early November. By the end of trading, GSG reached its highest weekly close since July.
A key driver of GSG’s rise: OPEC, Russia, and other oil producers agreed to a cut in output to address a supply glut. “The Saudi goal was not necessarily to push oil prices significantly higher, but rather… to put a firm floor under them during the first quarter to temper any seasonal weakness,” says Amrita Sen, co-founder of Energy Aspects, a consultancy.
ING notes that while the cuts are “clearly more than the market was expecting and has been constructive in the immediate-term, the key question is whether this is enough? We do not expect that these cuts will bring the market to balance over 1Q20. However, the cuts will take a significant surplus down to less daunting levels.”
In the loser’s column last week: a broad measure of US investment-grade bonds (BND) and US REITs (VNQ), which shed 0.2% each.
Broad-based gains in markets last week lifted an ETF-based version of the Global Market Index (GMI.F) — an unmanaged benchmark that holds all the major asset classes (except cash) in market-value weights. GMI.F rose 0.3%, building on the previous week’s fractional increase.
For the one-year trend, US stocks took the lead, displacing Vanguard Real Estate (VNQ), which had held the top spot for an extended period. At last week’s close, however, Vanguard Total US Stock Market (VTI) regained the lead, posting an 18.3% total return for the trailing one-year window, modestly ahead of VNQ’s 15.7%, the second-strongest increase over the past 12 months.
Despite GSG’s strong rise last week, broadly defined commodities continue to post the weakest one-year performance for the major asset classes. Note, however, that GSG is no longer in the red: the fund gained 3.0% over the last 12 months.
Meanwhile, GMI.F continues to post a strong performance for the one-year period: 14.4% after factoring in distributions.

Profiling all the ETFs listed above through a momentum lens continues to reveal a strong upside bias overall. The analysis is based on two sets of moving averages. The first compares the 10-day moving average with its 100-day counterpart — a proxy for short-term trending behavior (red line in chart below). A second set of moving averages (50 and 200 days) represent the intermediate measure of the trend (blue line). At last week’s close, a majority of the major asset classes continue to post a bullish posture.

Disclosure: None.


