
Commodities And Stocks Surged Last Week
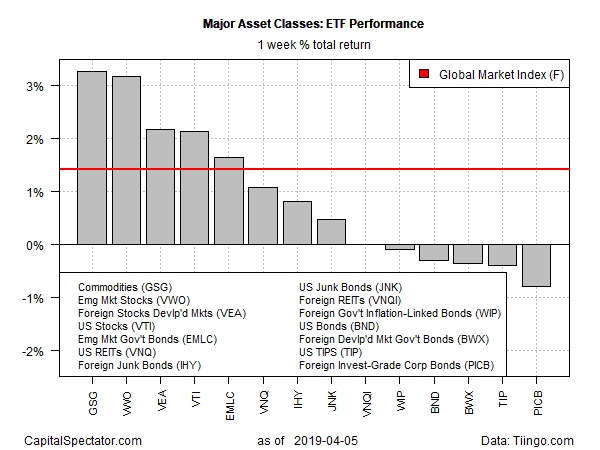
Commodities and equity markets around the world posted the strongest gains for the major asset classes during the trading week through Friday, April 5, based on a set of exchange-traded funds. Meanwhile, most bond markets retreated.
Last week’s top performer: iShares S&P GSCI Commodity-Indexed Trust (GSG). This broad measure of commodities increased 3.3%, lifting the fund to its highest close since November. The latest gain marks the fifth straight weekly advance for GSG.
The second-strongest gainer last week: emerging-market stocks. Vanguard FTSE Emerging Markets (VWO) rose 3.2%, closing at its highest price since last June.
“Last week, we saw some pretty clear signs of reaction to news on the trade front and Chinese equities particularly sensitive to that rallied quite a bit,” notes Oliver Jones, a markets economist at Capital Economics.
The biggest setback in the first trading week of April: foreign corporate bonds. Invesco International Corporate Bond (PICB) slumped 0.8%, marking the ETF’s second straight weekly decline.
Last week’s rally lifted an ETF-based version of the Global Markets Index (GMI.F). This investable, unmanaged benchmark that holds all the major asset classes (except cash) in market-value weights jumped 1.4% over the five trading days through April 5. The gain marks the third weekly advance in the past four weeks for the index.
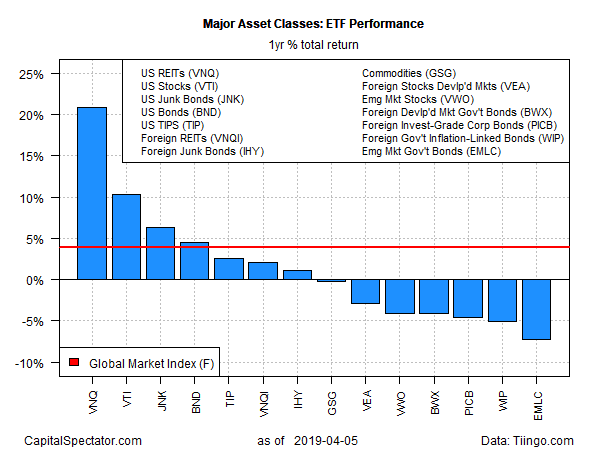
For the one-year trend, US real estate investment trusts (REITs) continue to lead the major asset classes by a wide margin. Vanguard Real Estate (VNQ) is enjoying a strong 20.8% total return for the past year (252 trading days). The performance is well ahead of the second-best one-year return via US stocks: Vanguard Total Stock Market (VTI) is up 10.3% for the trailing one-year window.
The biggest one-year setback at the moment is in emerging-market bonds. VanEck Vectors J.P. Morgan EM Local Currency Bond (EMLC) closed down 7.3% at Friday’s close vs. the year-earlier level after factoring in distributions.
GMI.F’s one-year performance is a moderate 4.0% gain.
Upside momentum remains strong for the major asset classes overall, based on two sets of moving averages for the ETFs listed above. The first definition compares the 10-day moving with the 50-day average, providing a profile of short-term trending behavior (red line in chart below). A second set of moving averages (50 and 200 days) offers an intermediate measure of the trend (blue line). The metrics range from 0 (all funds trending down) to 1.0 (all funds trending up). Based on data as of last week’s close, bullish momentum is deep and wide for nearly every slice of the major asset classes.

Disclosure: None.


