
Commitment Of Traders: What Hedge Funds Are Buying
Following futures positions of non-commercials are as of September 1, 2020.
10-year note: Currently net short 13.5k, up 85.8k.
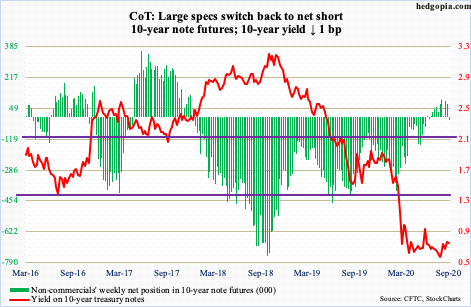
The 10-year Treasury yield (0.72 percent) remains rangebound between 0.57 percent and 0.74 percent. There was some excitement among bond bears (on price) last week when on both Thursday and Friday rates were brushing against the top end of the nearly-six-month rectangle. But then, bulls took control right from the word go this week as yields came under pressure.
By Thursday, the 10-year yield was down to 0.61 percent, slightly breaching the 50-day moving average (0.63 percent). Then came August’s slightly-better-than-expected jobs report, which helped push the yield back above the average on Friday. In the end, the 10-year only lost a basis point for the week.
Once again, bears are eyeing the top end of the range. Non-commercials, in the meantime, switched to net short 10-year note futures this week. This is the first time in 11 weeks they are net short. They have been vacillating a lot of late, but right here and now they expect a range resolution to the upside. Fingers crossed!
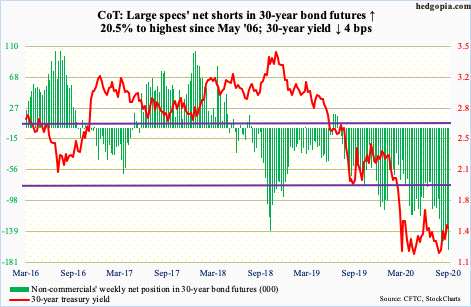
30-year bond: Currently net short 164.8k, up 28k.
Major economic releases next week are as follows. Markets are closed Monday for observance of Labor Day.
The NFIB optimism index (August) is due out Tuesday. Small-business optimism fell 1.8 points month-over-month in July to 98.8. Job openings dropped two points m/m to 30; the sub-index is down from 38 in February but up from 23 in May.
Non-farm job openings (JOLTS, July) will be published Wednesday. Openings rose 518,000 m/m in June to 5.9 million. Earlier, they fell from seven million in February to five million in April.
Thursday brings the producer price index (August). Producer prices fell 0.1 percent m/m in July and rose 1.9 percent in the 12 months to July. Core PPI over the same time period was unchanged and up 1.9 percent, in that order.
The consumer price index (August) is on tap for Friday. In July, consumer prices rose 0.6 percent m/m and one percent year-over-year. Over the same time period, core CPI increased 0.6 percent and 1.6 percent, respectively.
WTI crude oil: Currently net long 572.8k, down 6.5k.
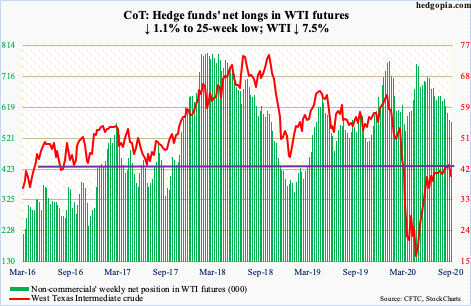
The EIA report for the week of August 28 was soft across the board, which probably owes it to Hurricane Laura. US crude production dropped 1.1 million barrels per day to 9.7 mb/d; this was the lowest since January 2018. Crude imports were down one mb/d to 4.9 mb/d. Stocks of crude, gasoline and distillates shrank by 9.4 million barrels, 4.3 million barrels and 1.7 million barrels to 498.4 million barrels, 234.9 million barrels and 177.5 million barrels, in that order. Refinery utilization tumbled 5.3 percentage points to 76.7 percent.
Wednesday, the day the EIA report was published, WTI ($39.77/barrel) dropped 2.9 percent – essentially closing on the 50- and 200-day (respectively $41.42 and $41.49), which are converging. By Friday, the averages were lost. Looking at the weekly, bears likely will continue to prevail. There is decent support at $34-35.
E-mini S&P 500: Currently net short 25.6k, down 61k.
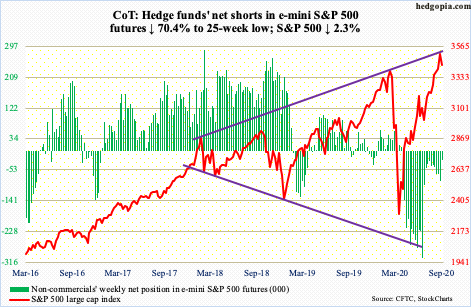
The S&P 500 (3426.96) has been caught in an ascending broadening wedge since early 2018. This year’s February-March selloff stopped at the lower line of this pattern (more on this here). The wedge also lines up with the underside of a broken trend line from the March 2009 low. Wednesday’s intraday high of 3588.11 kissed the upper line; Thursday, sellers showed up in droves, with the index tumbling 3.5 percent and then another 0.8 percent on Friday.
Bulls have tons of profit on paper. From the March low through Wednesday’s high, the S&P 500 surged 63.7 percent! In just over five months. Unreal! Bears obviously have put their foot down at the aforementioned resistance. In a volatile session Friday, when at one time the index was down as much as 3.1 percent, bulls were able to save 3390s, which represents the prior high from February. Given how extended the index is, a breach will occur, it is just a matter of how soon.
What bulls do not want to see happen is a pickup in outflows. In the week to Wednesday, US-based equity funds lost $8 billion (courtesy of Lipper), while SPY (SPDR S&P 500 ETF), VOO (Vanguard S&P 500 ETF) and IVV (iShares Core S&P 500 ETF) collectively lost $4.3 billion (courtesy of ETF.com).
Euro: Currently net long 196.7k, down 15k.
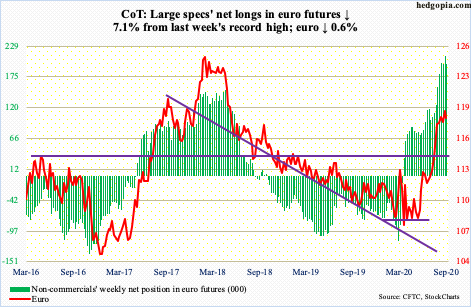
Euro bulls once again went after 17-plus-year resistance at $1.19-1.20 – and were rejected. Tuesday, the euro ($1.184) rallied to $1.201 intraday but only to reverse and end the session down 0.2 percent; this was the highest print since April 2018.
The 10- and 20-day continue to flatten out and could be on the verge of a convergence, followed by a cross-down. Should things evolve this way, the currency likely proceeds to unwind the overbought condition it is in. On March 20, it tagged $1.064 intraday.
Nearest support lies at $1.17. Then there is horizontal support at $1.145. The 50-day at $1.165 lies in between.
Gold: Currently net long 230.8k, up 9.8k.
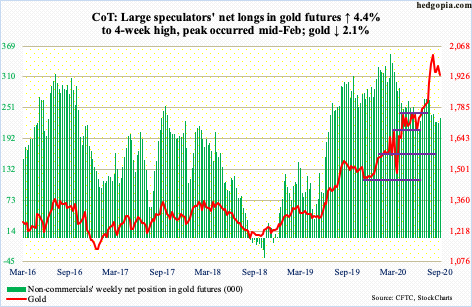
August produced a monthly spinning top with really long shadows. This was a month gold ($1,934.30/ounce) rallied to a new intraday high of $2,089.20; earlier, the metal bottomed on March 16 at $1,450.90 – meaning August’s candle followed a massive rally.
Since that high, gold has trended lower with lower highs, but at the same time gold bugs have defended $1,920s, which is where gold peaked back in September 2011. Just underneath lies the 50-day at $1,909.80.
As this sideways-to-slightly-down price action unfolds, ETF flows have slowed down. In the week to Wednesday, another $544 million moved into IAU (iShares Gold Trust), for a 24-week haul of $7.5 billion. During that time, GLD (SPDR Gold ETF) witnessed four down weeks, three of which came in the last four, including this week’s outflows of $129 million; altogether, $18.1 billion came into the ETF during those 24 weeks (courtesy of ETF.com).
As gold is clinging on to support, how GLD flows behave likely holds the key near term.
Nasdaq 100 index (mini): Currently net long 8.6k, down 11.1k.
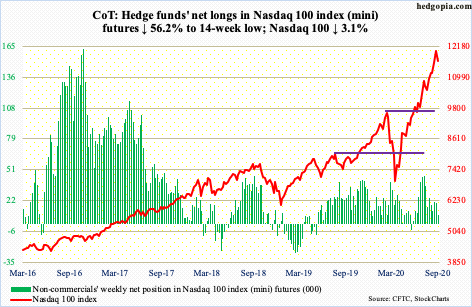
The generals ran out of ammo. As simple as that! From the March low through Thursday’s intraday high, the Nasdaq 100 shot up 83.4 percent! The heavy lifting was done by the leading names such as Apple (AAPL), Amazon (AMZN) and Microsoft (MSFT). The soldiers were struggling to keep up.
On June 2, the percent of Nasdaq 100 stocks above the 50-day peaked at 98 percent and continued lower, even as the index marched higher. Wednesday – before Thursday’s 5.2-percent collapse in the index – this metric stood at 85 percent and ended the week at 60 percent. Several times in the past, the soldiers have shown a tendency to eventually drag the generals lower (more on this here).
Wednesday’s intraday high of 12439.48 came in a dragonfly doji session. The candle can mark potential reversal. The Nasdaq 100 remains overbought on nearly all timeframes. Nearest support lies at 11000, which approximates the 50-day at 11041.87. Friday, the index (11622.13) dropped as low as 11145.99 before buyers showed up. This helped the index close right on channel support from the March low; selling will accelerate once a breach occurs.
Russell 2000 mini-index: Currently net long 8.3k, down 10k.
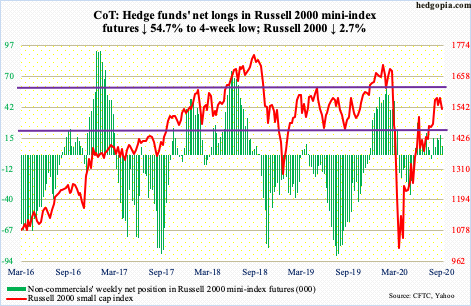
The rejection four trading weeks ago at 1600-plus, which has proven to be a crucial price point going back to January 2018, is proving costly. To get this far, small-cap bulls obviously expended a lot of energy. The Russell 2000 (1535.30) bottom-ticked 966.22 on March 18.
Even after getting rejected at that resistance on August 11, bulls kept trying to regroup and hammer on that ceiling. Both Wednesday and Thursday this week, the index retreated from 1590s, most noticeably on Thursday when it tumbled three percent.
Bears will now be eyeing 1450s-60s, and 1340s-50s after that.
US Dollar Index: Currently net short 6.7k, down 1k.
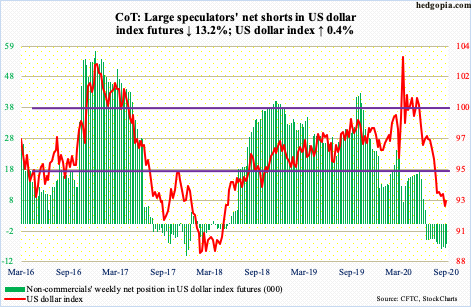
Dollar bulls put their foot down in a hammer session Tuesday but not before tagging 91.75 intraday, which was the lowest since May 2018. In the end, support just north of 92, which goes back at least 17 years, was saved. A genuine breach of this support opens the door to a test of 88-89.
Thus far, bulls have done a good job of defending 92 on the US dollar index (92.71). The sideways-to-slightly-down price action for a month now has flattened out the 10- and 20-day. Merely 0.18 separate the two. Bulls need a crossover for momentum to build.
VIX: Currently net short 95.8k, down 2.4k.
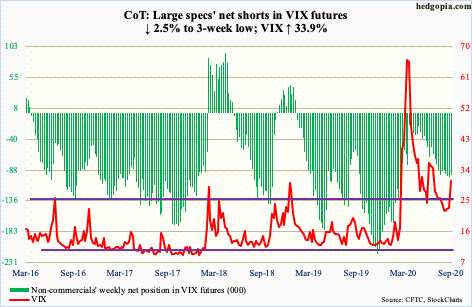
VIX (30.75) rallied big this week, up 7.79 points. This was preceded by two back-to-back weekly long-legged dojis and a spinning top before that. Longer-term, on the monthly, several indicators including the RSI are hooking up from the median. The path of least resistance increasingly is looking up.
Near-term, the daily is beginning to look extended. Thursday’s intraday high of 35.94 stopped right at horizontal resistance at 36-37. Friday, it tried to rally again, with a high of 38.28, but momentum soon petered out. Nearest support lies at 30-31, which is where Friday closed. Then comes the 200-day at 28.36.
Elsewhere, there is a long way to go before the prevailing froth comes out of the 21-day moving average of the CBOE equity-only put-to-call ratio. Wednesday, it dropped to 0.439 – a new low – with the week closing out at 0.46. If past is prelude, the ratio in due course can rally to low- to mid-0.70s before the pendulum swings to the overly pessimistic side. Right now, there is too much optimism all around.


