
Commitment Of Traders Weekly Report - The Future Of Futures, Hedge Funds Positions
Following futures positions of non-commercials are as of July 16, 2019.
10-year note: Currently net short 347.2k, up 58.4k.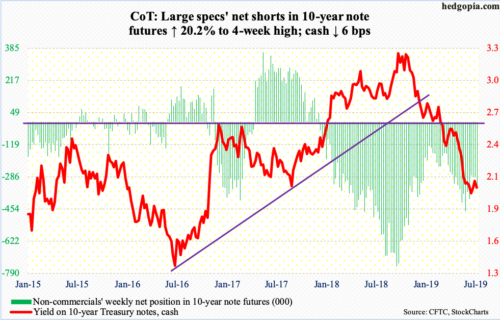
In its quest to justify a rate cut later this month, the Fed may be inadvertently creating a precedent that it may come to regret later. For several months now, markets have priced in at least a couple of 25-basis-point cuts this year. Not to mention President Donald Trump’s vocal resistance to higher rates. The Fed is giving in. Several times in the recent past, Chair Jerome Powell all but confirmed a cut, most recently during last week’s Humphrey-Hawkins testimony.
But data is not quite cooperating. Several, including retail sales and the payroll report for June, point to an economy that is not quite ready to fall apart just yet. Cornered, FOMC doves have come up with a new excuse. Thursday, John Williams, New York Fed president, who is a permanent voting member, said “it’s better to take preventative measures than to wait for disaster to unfold”. The same day, Richard Clarida, Fed vice chair, made similar comments.
The problem is, the bank’s conventional monetary quiver seriously lacks sufficient arrows. The fed funds rate currently stands at 225 to 250 basis points. This new line of thinking is bound to have at least two repercussions. One, from now on, markets will demand an ‘insurance’ cut well before any visible weakness in the raw data. Two, this ensures QE sooner than it would otherwise be possible. It is only after it is done firing the fed funds bullet, the Fed will go the QE route, which is what markets are really after, come to think of it.
30-year bond: Currently net short 21.7k, up 10.6k.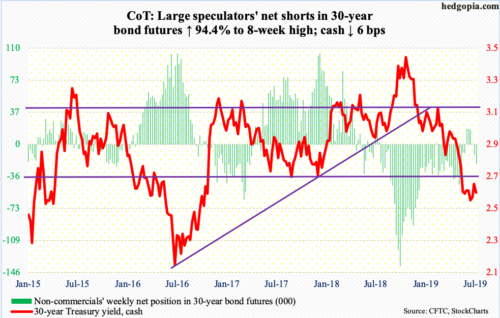
Major economic releases next week are as follows.
Existing home sales (June) are due out Tuesday. May sales rose 2.5 percent month-over-month to a seasonally adjusted annual rate of 5.34 million units. The cycle high 5.72 million units was reached in November 2017.
New home sales (June) come out Wednesday. Sales in May dropped 7.8 percent m/m to 626,000 units (SAAR). The cycle high 715,000 units was recorded in November 2017.
Durable goods orders (June) are scheduled for Thursday. In the 12 months to May, orders for non-defense capital goods ex-aircraft – proxy for business capex plans – rose 1.4 percent to $69 billion (SAAR). Last July, orders reached a record $70 billion.
Friday brings GDP (2Q19, first print). As of Wednesday, the Atlanta Fed’s GDPNow model forecasts 1.6 percent growth in real GDP. In 1Q, the economy grew 3.1 percent.
Crude oil: Currently net long 585.1k, up 24k.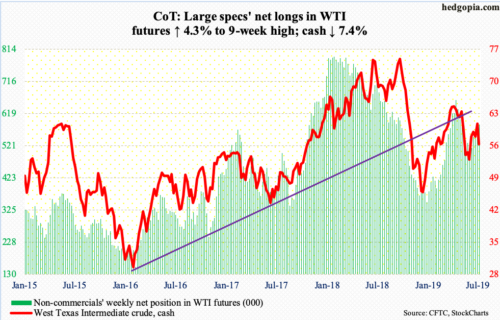
After last week’s failed attempt, the cash ($55.76/barrel) early this week once again went after trend-line resistance from the highs of April this year and October last year, when the crude respectively peaked at $66.60 and $76.90. Bears put their foot down Monday. In the end, WTI ended up dropping in the first four sessions, down 7.4 percent for the week and past both 50- and 200-day moving averages. There is trend-line support from last December’s lows around $53. In June, bulls defended $50-51.
Not surprisingly, Tropical Storm Barry impacted offshore crude production last week. In the week to July 12, US production fell 300,000 barrels per day to 12 million bpd. Crude imports dropped 470,000 bpd to 6.8 mbpd. As did crude stocks, which declined 3.1 million barrels to 455.9 million barrels. Refinery utilization contracted three-tenths of a percentage point to 94.4 percent. Gasoline and distillate stocks rose by 3.6 million barrels and 5.7 million barrels respectively to 232.8 million barrels and 136.2 million barrels.
E-mini S&P 500: Currently net long 38.4k, up 21.2k.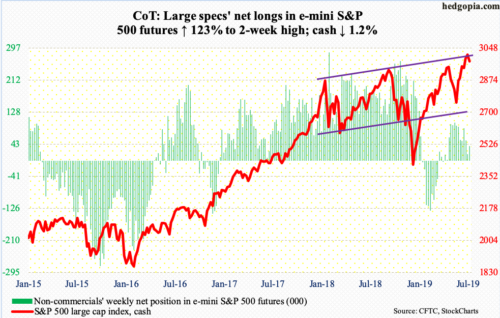
The cash (2976.61) rallied to yet another all-time high Monday (3017.80) before coming under pressure. Shorter-term averages are beginning to roll over. Bulls will try to defend these as long as possible. The problem they will increasingly face in the sessions ahead is extended technicals.
Immediately ahead, breakout retest takes place at 2950s-60s. And after that, the 50-day lies at 2900 and the 200-day at 2783. The latter approximates crucial support at 2800, which was briefly lost during the May sell-off but was recaptured in June.
Bulls should be happy with how flows have fared in recent weeks. In the week to Wednesday, US-based equity funds gained $3.7 billion (courtesy of Lipper). In the same week, SPY (SPDR S&P 500 ETF), VOO (Vanguard S&P 500 ETF) and IVV (iShares core S&P 500 ETF) attracted a combined $6.4 billion (courtesy of ETF.com).
Foreigners in the meantime continued to reduce exposure to US stocks in May, having sold $1.4 billion worth. In April, they sold $964 million worth. That said, the pace of selling has moderated. In the 12 months to May, selling totaled $189 billion, down from a record $214.2 billion in April. Bulls hope the trend continues. Historically, foreign purchases – or a lack thereof – tend to go hand in hand with the S&P 500 index.
Euro: Currently net short 31.4k, down 4.5k.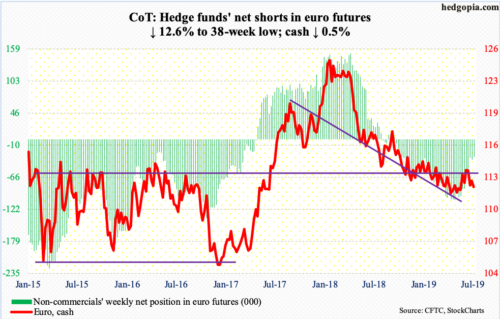
Support at $112 was tested several times this week on the cash ($112.18) – successfully. The daily has room to go higher near term, and for that this support needs to hold. Immediately ahead, resistance lies at $113. The 200-day is at $113.28. Late June, the currency retreated from just north of $114, with a high of $114.06 on the 24th, which euro bulls would love to take out for added momentum.
Gold: Currently net long 245.5k, up 738.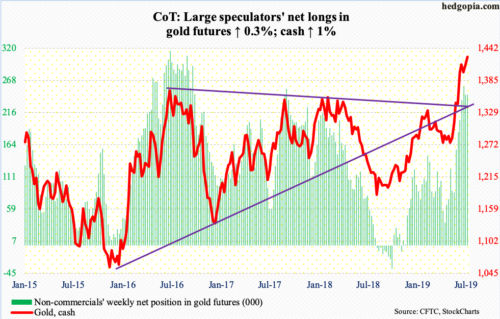
This was yet another week in which gold bugs got denied at $1,440s. The cash ($1,426.70/ounce) Friday rallied 1.8 percent intraday but only to edge lower 0.1 percent by close. This week’s spinning top preceded a spinning top last week, and a long-legged doji and a shooting star before that.
Daily Bollinger bands have narrowed quite a bit. A sharp move is likely upon us – either up or down. The weekly is overbought. A month ago, gold broke out of $1,350s-1,360s. A successful breakout retest can refuel the bullish momentum. Despite the one-month sideways move, flows have not disappointed.
In the week to Wednesday, IAU (iShares gold trust) attracted $49 million. GLD (SPDR gold ETF) took in $120 million; in the prior eight, it gained $2.9 billion (courtesy of ETF.com).
Nasdaq 100 index (mini): Currently net long 25.5k, up 7.5k.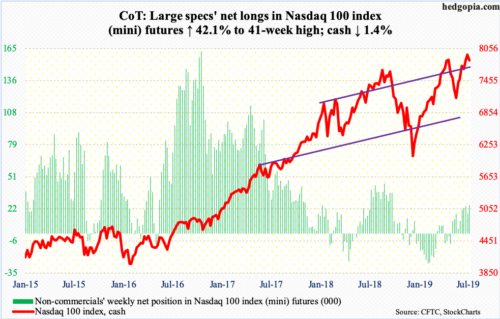
After losing $2.8 billion in the prior two weeks, QQQ (Invesco QQQ trust) gained $190 million in the week to Wednesday (courtesy of ETF.com). Bulls Thursday defended three-month support at 7850s, but only to come under renewed pressure on Friday.
The cash (7834.90) opened the week with a rally to a new intraday high of 7969.79 on Monday, but bulls were not able to build on that breakout much. Ideally, they would love to squeeze shorts. Nasdaq short interest is the highest since February 2016.
At the same time, technicals are getting extended. In the event of a pullback, it is likely shorts begin to cover near support. The 50-day lies at 7569 and the 200-day at 7176. The latter approximates trend-line support from last December’s lows.
Russell 2000 mini-index: Currently net short 88.7k, up 8.1k.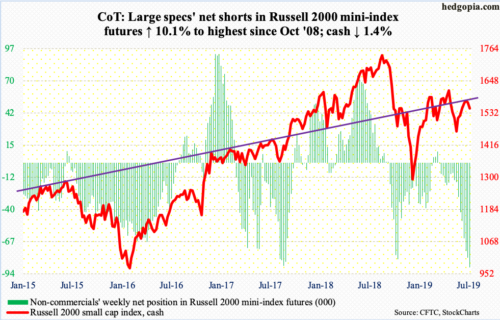
Shorter-term moving averages are rolling over. The cash (1547.90) is still above both 50- and 200-day, but momentum lacks. Both averages are pointing down. For the week, the Russell 2000 index was down 1.4 percent. Last week, a potentially bearish hanging man showed up and a long-legged doji before that.
Non-commercials are piling on, with net shorts at the highest since October 2008.
US Dollar Index: Currently net long 27.3k, up 276.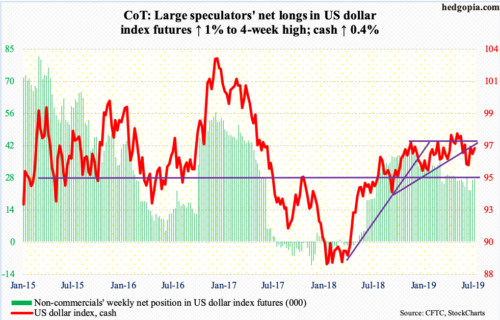
The battle between the daily and the weekly – one overbought and the other oversold – could be going with the former for now. The cash (96.82) was rejected at the 50-day several times, but at the same time the 200-day held. If the daily prevails, there is crucial support at 95, which was just about defended about a month ago.
VIX: Currently net short 141.8k, up 9.6k.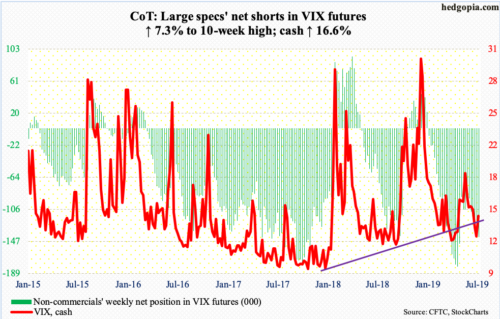
The S&P 500 just rose to a new all-time high, yet volatility bears have not been able to push the cash (14.45) under 12. The last time this level gave way was just over three months ago. VIX has remained suppressed for a while now, but it has done so at a higher plateau. Volatility bulls would hope this would eventually lead to a surge, but momentum is struggling to sustain. For now, VIX needs to take out 14.50s to begin to get any traction. The daily is itching to go higher near term.


