
Commitment Of Traders This Week: How Hedge Funds Are Positioning
Following futures positions of non-commercials are as of August 4, 2020.
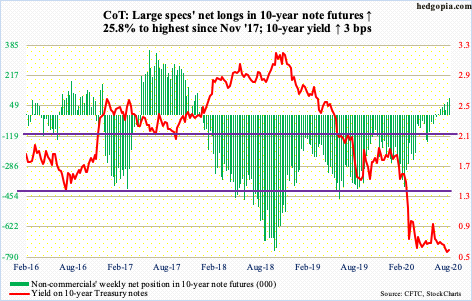
10-year note: Currently net long 92.1k, up 18.9k.
The Fed’s balance sheet peaked in the week to June 10 at $7.17 trillion, up nearly $3 trillion in three months. Since then, it has slightly trended lower, to $6.95 trillion as of Wednesday.
On the surface, this could be viewed as a bond negative, as this would mean less demand for treasury notes and bonds. Not quite. SOMA (System Open Market Account) holdings show the central bank continues to amass these assets – from $2.03 trillion in the week to March 11 to this week’s $3.65 trillion.
Of course, the pace of increase has moderated – from a week-over-week increase of $335.7 billion in the week to April 1 to $8.4 billion this week. The bigger question is, can this deceleration continue, given the soaring budget deficit? The long end of the Treasury yield curve has doubts.
The 10-year yield (0.56 percent) lost support at 0.57 percent last week, tagged 0.5 percent intraday Thursday this week, before rallying Friday post-July jobs report. In fact, on Monday, bond bulls (on price) showed up at the falling 10-day moving average when rates tagged at 0.57 percent. Regardless what happens near term, the bias remains down. Non-commercials are positioning themselves this way.
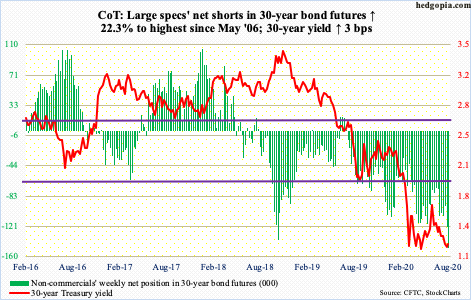
30-year bond: Currently net short 149.6k, up 27.3k.
Major economic releases next week are as follows.
JOLTS job openings (June) will be published Monday. May non-farm openings rose 401,000 month-over-month to 5.4 million. The series peaked in January last year at 7.5 million.
NFIB job openings (July) are due out Tuesday. In June, they increased nine points m/m to 32. In three separate months between December 2018 and July last year – the other being March last year – the metric hit 39, which was a record.
The consumer price index (July) comes out Wednesday. In the 12 months to June, core CPI rose 1.2 percent, which was the slowest pace since February 2011.
Friday brings retail sales (July), productivity (2Q20), industrial production (July) and the University of Michigan’s consumer sentiment index (August, preliminary).
After three straight y/y decline, retail sales increased 1.1 percent in June to $524.3 billion (SAAR). Sales reached record high $529.6 billion in January.
In 1Q20, non-farm output/hour rose 0.65 percent from the year-ago quarter. This was the weakest growth rate since 1Q16.
Capacity utilization in June rose 5.4 percent m/m to 68.6 percent. Utilization was 64.2 percent in April.
In July, consumer sentiment slid 5.6 points m/m to 72.5. April’s 71.8 was the lowest since December 2011.
WTI crude oil: Currently net long 645.4k, up 7.6k.
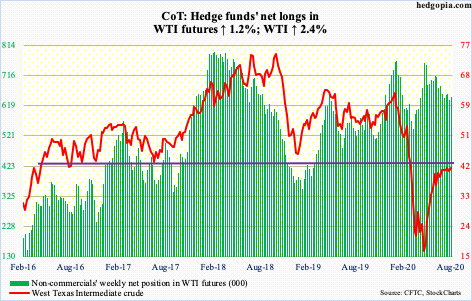
Four sessions after successfully testing the 50-day, WTI ($41.22/barrel) unsuccessfully tested the 200-day ($42.89) on Wednesday. Merely $3.20 separate the averages. The 10- and 20-day are already converging. Daily Bollinger bands have narrowed as well. It increasingly feels like the crude is setting up for a big move – most likely to the downside. A loss of the 50-day opens the door to a test of $34-35. In the event of a breakout, bulls will be eyeing $48-49.
In the meantime, US crude production in the week to July 31 declined 100,000 barrels per day to 11 million b/d. Crude stocks dropped 7.4 million barrels to 518.6 million barrels. Gasoline and distillate stocks rose – up 419,000 barrels and 1.6 million barrels to 247.8 million barrels and 180 million barrels, in that order. Crude imports, too, were up 864,000 b/d to six mb/d. Refinery utilization inched up one-tenth of a percentage point to 79.6 percent.
E-mini S&P 500: Currently net short 44.8k, up 5.5k.
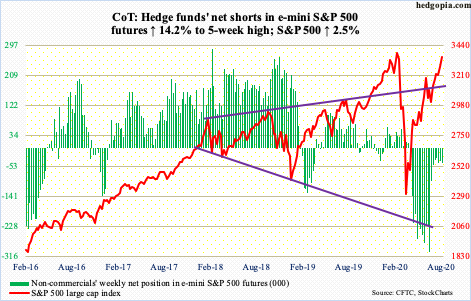
After defense of the 20-day seven sessions ago, the S&P 500 is up 4.6 percent! As unreal as it sounds, it is what it is. Volume meanwhile continues to be anemic. This divergence likely proves costly at some point, but right here and now price is what matters.
The index (3351.28) was up in all five sessions this week, rallying all long the now-rising daily upper Bollinger band. The gap from February 24 has been filled (more on this here). The February 19th all-time high of 3393.52 is 1.3 percent away – only a matter of time it is tested.
In less than six months, the S&P 500 has been through quite a roller-coaster ride. At the low on March 23, it tagged 2191.86. From that trough, it would have rallied 55 percent to test its February high. All this was made possible without much cooperation from flows. Between March 23 and Wednesday this week, SPY (SPDR S&P 500 ETF), VOO (Vanguard S&P 500 ETF) and IVV (iShares Core S&P 500 ETF) collectively lost $4.8 billion (courtesy of ETF.com), while US-based equity funds lost $86.5 billion (courtesy of Lipper).
Euro: Currently net long 180.6k, up 23.1k.
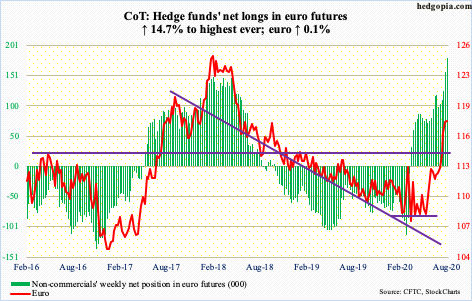
Last week, the euro ($117.89) broke out of a falling trend line from April 2008 when the currency peaked at $160.20. This week, Monday’s weakness was bought at the sharply rising 10-day, which was again defended Tuesday. Wednesday’s intraday high of $119.06 then proceeded to test horizontal resistance at $119-120, which goes back to May 2003.
Less than five months ago – on March 20, to be specific – the euro bottom-ticked $106.35. Conditions are extended, daily and weekly in particular. On the weekly, the RSI surpassed 70 on Thursday – the first time this has happened since January 2018. Back then, on the 25th that month, it hit $125.37 and then pretty much went sideways for three months before the bottom fell out.
How things evolve around $119-120, therefore, is important. Momentum lies with the bulls, who should be fine as long as the 10- and 20-day are intact, with a slight breach of the former ($117.97) on Friday.
In the meantime, non-commercials’ net longs jumped to yet another record. There is way too much optimism, and it pays to be a contrarian in a time like this.
Gold: Currently net long 238.7k, up 1.9k.
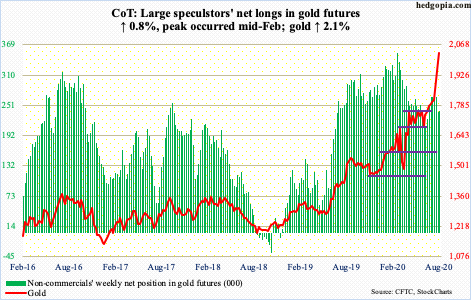
The daily RSI hit 90.54 Thursday. At least going back 20 years, it has never been this high. Particularly the last three weeks, gold ($2,028/ounce) has gone parabolic, having rallied 15-plus percent. This week, it added 2.1 percent but was up as much as 5.2 percent at one time. Friday, the metal posted a new intraday high of $2,089.20 before reversing lower, down two percent.
Flows continued to be positive. In the week to Wednesday, IAU (iShares Gold Trust) took in $333 million and GLD (SPDR Gold ETF) $1.6 billion (courtesy of ETF.com). IAU has witnessed inflows for 20 weeks straight, for a total haul of $6.4 billion; GLD had one down week during that period, gaining $19.2 billion. This coincided with the metal’s bottom on March 16 at $1,450.90. Soon fell the 200- and 50-day and other important levels such as $1,560s, $1,700, $1,750s-60s and finally last week the prior high of $1923.70 from September 2011.
Ideally, a successful breakout retest of $1,920s would further strengthen gold bugs’ hands, as this might even attract a new set of investors who missed out on the recent move. Gold is benefiting from real rates, among others (more on this here). The breakout took place after a nine-year base. If it is a genuine breakout, using a measured move approach, technicians would be looking to add $800-plus from the breakout point. Hence the significance of a retest, which looks probable.
Nasdaq 100 index (mini): Currently net long 18.3k, down 5.8k.

Last Friday’s potentially bearish hanging man was not confirmed. The Nasdaq 100 (11139.39) began the week with Monday’s gap-up, followed by positive sessions in the next three sessions, all along the daily upper Bollinger band – to Thursday’s new intraday high of 11282.24. Bulls now have carved out decent support at 11000, which was kind of tested Friday.
Flows were negative in the week to Wednesday, with QQQ (Invesco QQQ Trust) losing $487 million, but this obviously is just one variable. Among others, QQQ short interest remains elevated. Mid-July, it fell five percent period-over-period to 62.3 million, but the preceding period’s 65.6 million was a three-and-a-half-month high. Zealous shorts have consistently lent a helping hand to the longs.
Russell 2000 mini-index: Currently net long 7.6k, down 8k.
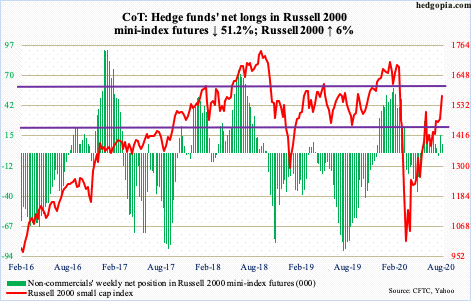
After pretty much hugging 1450s-60s for two weeks, the Russell 2000 (1569.18) decidedly pulled away this week. The June 8th high of 1537.62 has been eclipsed for a higher high. This should raise small-cap bulls’ hopes that a test of 1600-plus is in the cards. This level goes back to January 2018 and has proven crucial for bulls and bears alike.
Hopefully for bulls, this week’s action will help attract flows. At least in the week to Wednesday, $1.8 billion was redeemed from IWM (iShares Russell 2000 ETF), while IJR (iShares Core S&P Small-Cap ETF) took in $181 million (courtesy of ETF.com).
US Dollar Index: Currently net short 6.5k, down 252.
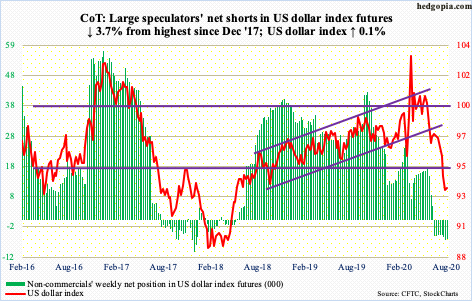
Monday’s rally attempt stopped at the 10-day, resulting in a shooting star session. The US dollar index (93.43) met with the same fate Tuesday. Come Friday, the average got taken out, albeit slightly.
From dollar bulls’ perspective, the good thing is that last Friday’s low of 92.52 held, with Thursday’s (this week) doji session breaching that low by 0.02. Horizontal support just north of 92 goes back at least 17 years.
Early last week, a rising trend line from May 2011, when the index bottomed at 72.70, was breached. Monday’s intraday high of 93.98 kissed the underside of that broken support. It needs watching. Otherwise, the index is primed for a relief rally – magnitude and duration notwithstanding. The weekly produced a long-legged doji this week.
Inability for the index to stabilize around here makes it vulnerable to a test of 88-89.
VIX: Currently net short 87.5k, down 1.4k.
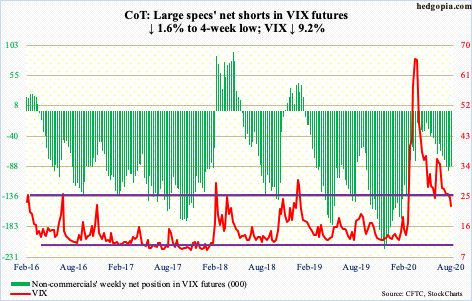
For the first time since February 24, VIX (22.21) traded with a 20 handle. Thursday’s intraday low of 20.97 also came in a spinning top session. Tuesday was a doji. For a month now, the index has pretty much been trading along the now-slightly-falling daily lower Bollinger band.
Volatility bulls better hope rally attempts going forward do not face resistance at mid-20s.
Once the volatility index reversed lower after peaking at 85.47 on March 18, several support levels gave way, which then consistently resisted rally attempts – 36-37 in June and 30-31 in July.


