
Commitment Of Traders - Seeing The Future Thru Futures
Following futures positions of non-commercials are as of September 29, 2020.
10-year note: Currently net long 128.6k, up 46.4k.
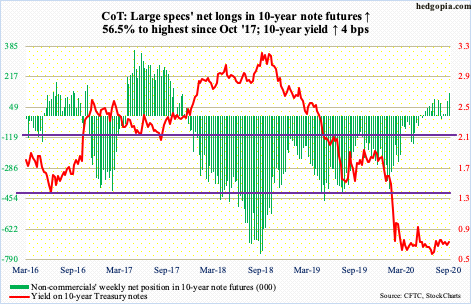
FOMC minutes for the September 15-16 meeting are due out Wednesday Oct. 7. Rates at that meeting were obviously left unchanged between zero and 25 basis points. Earlier, at the Jackson Hole symposium late August, Chair Jerome Powell said the central bank would let inflation stay above its two percent target, suggesting rates will remain low for a long time to come.
Even before this, in March, the Fed announced unlimited QE and said it would begin buying investment-grade corporate bonds, which in April was expanded to also include junk bonds. Consequently, it already holds $7.06 trillion in assets, slightly lower than the record $7.17 trillion set in the week to June 10. When the year began, its balance sheet was $4.17-trillion strong.
The Fed has already thrown so much monetary stimulus at Covid-19. Markets expect nothing out of this week’s minutes. If anything, the message Fed officials have been sending of late is that they know their monetary tools are running low – if not completely out – hence their pleas to Congress for fiscal help.
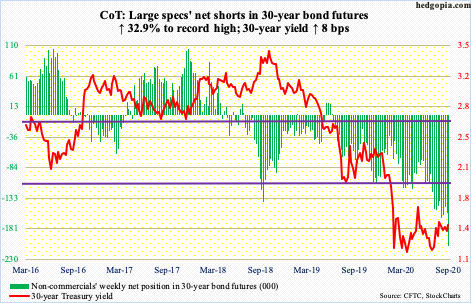
30-year bond: Currently net short 208.8k, up 51.7k.
Major economic releases next week are as follows.
On Monday, the ISM non-manufacturing index (September) is published. Services activity in August dropped 1.2 points month-over-month to 56.9. July’s 58.1 was a 20-month high.
Tuesday brings JOLTS job openings (August). In July, non-farm openings jumped 617,000 m/m to 6.62 million. April’s five million was a 64-month low.
The NFIB optimism index (September) is on tap for Thursday. Small-business job openings increased three points m/m in August to 33. Earlier, the sub-index reached 23 in May. Between December 2018 and July last year, a record 39 was hit three times.
WTI crude oil: Currently net long 537.6k, down 17.7k.
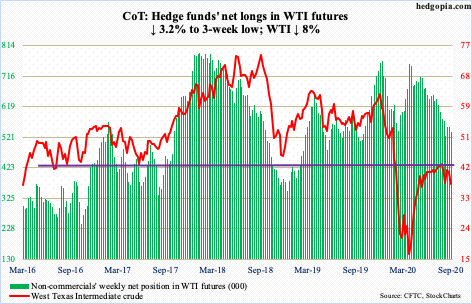
WTI ($37.05/barrel) continued to get caught in a confluence of moving averages. Early this week, the 50-day ($40.89) acted as a roadblock. Then came the 200-day ($39.66). The 10- and 20-day (respectively $39.57 and $39.15) lie around there as well.
Since August 26 when the crude tagged $43.78 intraday, rally attempts have been bound by a falling trend line, which was part of a pennant. This has now been lost. On September 8, oil bulls defended $36; this support has now taken on significance.
In the meantime, the EIA report for the week to September 25 showed US crude production remained unchanged at 10.7 million barrels per day; four weeks ago, production was down to 9.7 mb/d, which was the lowest since January 2018. Crude imports were down 46,000 b/d to 5.1 mb/d. As were stocks of crude and distillates – respectively down two million barrels and 3.2 million barrels to 492.4 million barrels and 172.8 million barrels. Refinery utilization was up a percentage point to 75.8 percent. Gasoline stocks, however, rose 683,000 barrels to 228.2 million barrels.
E-mini S&P 500: Currently net long 72.2k, up 12.5k.
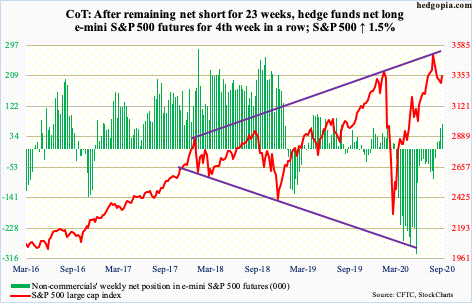
After four straight weekly drops, the S&P 500 index (3348.42) rallied 1.5 percent this week. Earlier, between the September 2nd record high of 3588.11 and the low of 3209.45 on the 24th, it quickly corrected 10.6 percent. Bulls defended 3200 – or 3220s-3230s, to be precise. This support goes back to last December.
In the rally that followed this week, bulls managed to reclaim the 50-day moving average (3361.60), although only fleetingly (more on this here). Wednesday, the index poked its head out of the average. Thursday, it struggled to stay above. Friday, the average was lost, albeit only slightly. Both Wednesday and Thursday, sellers showed up at 3390s, which is where the large-cap index peaked back in February – just before collapsing.
Bulls were probably happy with how flows fared in the week to Wednesday. For a change, merely $32 million came out of US-based equity funds (courtesy of Lipper). This followed a loss of $14.9 billion in the prior week and cumulative outflows of $42 billion in six. As well, after losing $7.1 billion in the prior week, SPY (SPDR S&P 500 ETF), VOO (Vanguard S&P 500 ETF) and IVV (iShares Core S&P 500 ETF) collectively gained $3.3 billion in the week to Wednesday (courtesy of ETF.com).
The question is, will this continue next week after the tentative price action later this week? On the weekly, even though it was a positive week, a shooting star formed.
Euro: Currently net long 188.1k, down 2.7k.
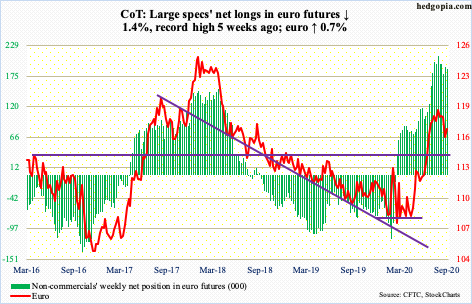
Monday last week, the euro ($1.1715) lost straight-line support at $1.17-$1.175, before quickly dropping to Friday’s intraday low of $1.1612. By Thursday this week, the breakdown was getting retested. The 50-day at $1.1799 lies just above. Sellers are likely to get active around this zone.
The currency remains overbought on both the weekly and monthly. Down the road, a test of horizontal support at $1.145 is the path of least resistance.
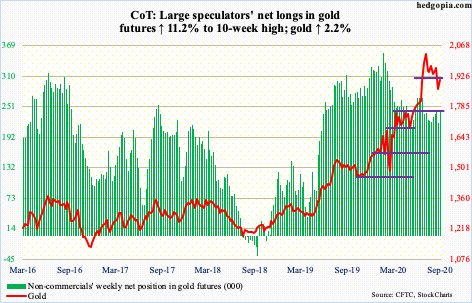
Gold: Currently net long 243.7k, up 24.6k.
For the first time in 28 weeks, IAU (iShares Gold Trust) lost $97 million in the week to Wednesday; in the prior 27, the ETF took in $8 billion. In those 27 weeks, GLD (SPDR Gold ETF) had five weeks of outflows for total gains of $19.2 billion; in the week to Wednesday, it attracted $105 million (courtesy of ETF.com). In short, flows are beginning to act hesitant.
As far as the week is concerned, gold bugs should be happy with how the metal performed. Last week, bids showed up at $1,850s. This week, bulls mustered enough strength to retest last week’s breakdown. Last Monday, gold ($1,907.60/ounce) sliced through important support at $1,920s as well as the 50-day. In September 2011, gold retreated after posting $1,923.70. This was surpassed in the last week of July, leading to a new high of $2,089.20 on August 7. Continued failure at $1,920s raises the odds of an eventual test of $1,750-1,800.
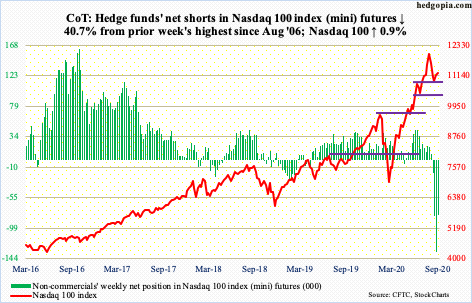
Nasdaq 100 index (mini): Currently net short 79.7k, down 54.6k.
QQQ (Invesco QQQ Trust) saw back-to-back inflows – $1.6 billion in the week to Wednesday and $2.2 billion before that (courtesy of ETF.com). After suffering three down weeks, the Nasdaq 100 rallied in two – up 0.9 percent this week and two percent before that. Earlier, between the record high 12439.48 on September 2 and 10677.85 on the 21st, it declined 14.2 percent.
On its way to that double-digit loss, the index breached its 50-day, but bears were unable to meaningfully build on that. Even before testing horizontal support at 10300-10400, bulls showed up at 10700s last week.
Monday, the Nasdaq 100 gapped up to recapture the 50-day and built on it further through Thursday’s high of 11606.73. It is possible shorts lent a helping hand. Mid-September, QQQ short interest was at a six-month high, and Nasdaq’s near a 12-year high (more on this here). Further, non-commercials as of last Tuesday were sitting on 134,311 net shorts in Nasdaq 100 index (mini) futures, which were the highest since August 2006; this week, this was reduced to 79,694 contracts.
If short squeeze helped, the tailwind was not powerful enough to push the Nasdaq 100 (11255.69) past 11500-11600. By Friday, the 50-day (11285.95) was lost, albeit slightly, with a weekly shooting star to boot. Shorts should like how the week ended.
Russell 2000 mini-index: Currently net long 8.6k, down 3.5k.
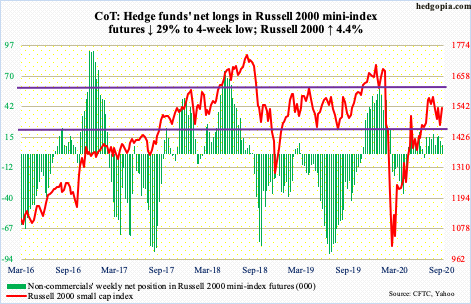
Last week, horizontal support at 1450s-1460s was tested – successfully. This area also held the 200-day (1454.80). This week, the Russell 2000 (1539.30) quickly rallied to test the 50-day (1533.58); 1530s also holds horizontal resistance – situated right between 1450s-1460s and crucial resistance at 1600-plus. The latter was unsuccessfully tested nearly two months ago. A break either way – up or down – has the potential to carry the near-term momentum.
US Dollar Index: Currently net short 5.6k, down 3.6k.
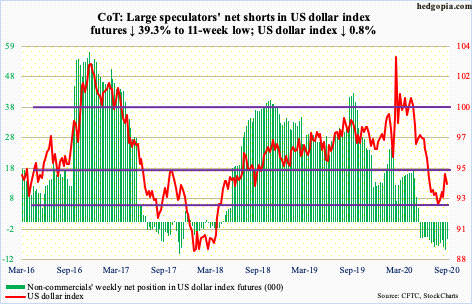
Last Wednesday, the US dollar index (93.91) broke out of a two-month range. It had been playing ping pong between 92 and 94 since late July. Prior to that, it dropped from 103.96 on March 23 to 91.75 on September 1.
Support at 92 goes back to at least June 2003 and was tested for nearly two months before the index began to lift off two weeks ago. In an ideal world, last week’s range breakout could culminate in a rally to 96. It still may, but for now the upward momentum stopped last Friday at 94.79.
This week, the US dollar index shed 0.8 percent. Last week’s breakout was tested. Thursday’s low of 93.57 also tested a rising trend line from September 1. Should this give way, dollar bulls need to step up and save the 50-day (93.32), which is now flattish. Failure to do so opens the door to a test of 92.70s.
VIX: Currently net short 89.8k, down 1.1k.
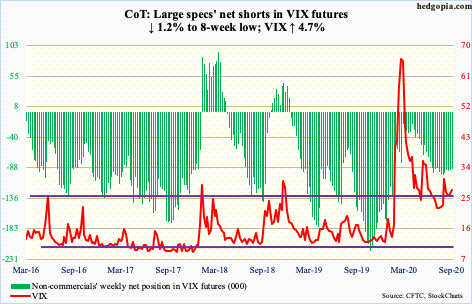
Since VIX (27.63) printed 38.28 intraday on September 4, the volatility index has made lower highs. Concurrently, the 200-day has stopped rally attempts, including Friday. Despite this, volatility bulls have persistently defended mid-20s support, which corresponds to the 50-day (25.30).
On the weekly, the MACD is on the verge of a potentially bullish crossover. It will bode well for volatility bulls should the weekly RSI, currently at the median, break through 55; the daily is itching to move up.
The aforementioned trend line from September 4 will be broken at 27.75, which is where the 20-day lies. Then comes the 200-day at 29.66.
Disclaimer: This article is not intended to be, nor shall it be construed as, investment advice. Neither the information nor any opinion expressed here constitutes an offer to buy or sell any ...
more

