Commitment Of Traders: Futures, Hedge Fund Positions This Week
Following futures positions of non-commercials are as of August 13, 2019.
10-year note: Currently net short 414.3k, up 23.5k.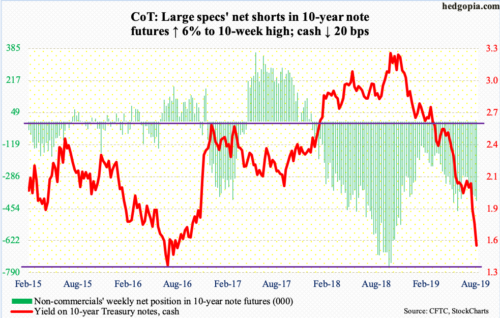
The 10-year Treasury yield (1.54 percent) shed 20 more basis points this week. In fact, at the lows rates were down as much as 25 basis points. Thursday’s intraday low of 1.48 percent was only 14 basis points from testing the low of 1.34 percent from July 2016, which was a successful retest of 1.39 percent set in July 2012.
In less than a year, the 10-year rate has been more than cut in half. Yields peaked at 3.25 percent last October. Amazingly, the long end of the curve (price) is rallying hard in a decent economic environment. Going back to 3Q16, there has been only one quarter of real GDP growth with a one handle, which was 4Q18. Four of the 12 quarters grew in the three percent range and the rest with a two handle, including 2Q19. This is not bad considering the US economy just completed a decade of expansion.
In comparison, in 2012, between 3Q12 and 2Q13, three out of four quarters, the economy only grew 0.5 percent. Then in 2016, between 3Q15 and 2Q16, there was only one quarter of growth with a two handle, with 4Q15 eking out a 0.1 percent gain. Viewed this way, it probably made sense for rates to drop to new lows back then, but it is difficult to make a sense out of what is transpiring now – unless the bond market is pricing in substantial weakness in the economy in quarters to come. Logically, thus, when the next downturn hits, rates will make newer lows. Non-commercials, who continue to hold sizable net shorts in 10-year note futures, will contribute to this as they cover.
30-year bond: Currently net short 67.3k, up 11k.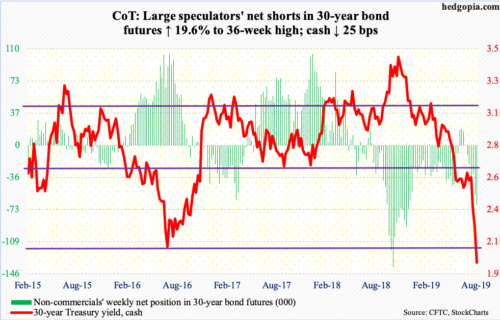
Major economic releases next week are as follows.
Existing home sales (July) and FOMC minutes (July 30-31 meeting) are scheduled for Wednesday.
Sales in June dropped 1.7 percent month-over-month to a seasonally adjusted annual rate of 5.27 million units. The cycle high 5.72 million was reached in November 2017.
In the July meeting, the Fed lowered the fed funds rate by 25 basis points to a range of 200 to 225 basis points – first cut since December 2008. In the futures market, traders have priced in two more 25-basis-point cuts this year, one each in September and October.
New home sales (July) come out Friday. June sales jumped seven percent m/m to 646,000 units (SAAR). The cycle high 715,000 was recorded in November 2017.
Crude oil: Currently net long 540.6k, up 20.1k.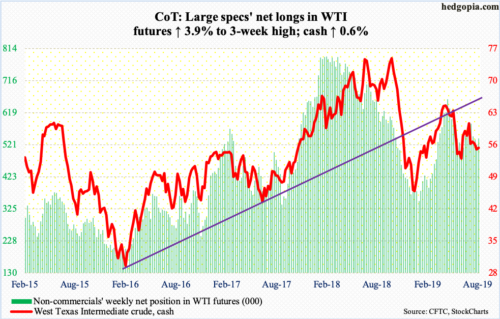
Last week, bulls defended support at $50-51/barrel. The subsequent rally peaked this Tuesday at $57.47, just north of the 200-day moving average ($56.49), which was again breached Wednesday. Inability to save a rising trend line from last December around $54 exposes the crude to a test – once again – of $50-51. In the best of circumstances for bulls, trend-line resistance from last October lies around $59. The 50-day, which is no longer pointing down, lies at $56.06.
The EIA report for the week of August 9 was mixed. Crude production remained unchanged at 12.3 million barrels per day. Crude imports rose 566,000 bpd to 7.7 mbpd. Crude stocks increased 1.6 million barrels to 440.5 million barrels. Gasoline and distillate stocks, however, fell 1.4 million barrels and 1.9 million barrels to 233.8 million barrels and 135.5 million barrels, respectively. Refinery utilization dropped 1.6 percentage points to 94.8 percent.
E-mini S&P 500: Currently net long 7.4k, down 81.5k.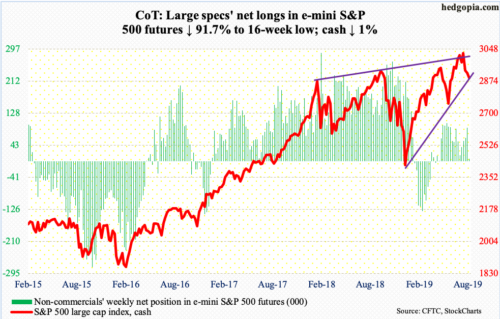
Last week’s lows were tested – successfully. Monday last week, the cash (2888.68) dropped to 2822.12 intraday before bulls stepped up. Support just north of 2800 goes back to March last year. Thursday this week, the S&P 500 dropped to 2825.51 intraday before attracting bids. For now, 2800 is the line in the sand, with rising odds it holds at least near term. The large cap index remains trapped between the 50- and 200-day (2944.78 and 2797.91, in that order). Before the 50-day is tested, bulls face resistance at the underside of a broken trend line from last December which lies around 2900.
In terms of flows, in the week through Wednesday, SPY (SPDR S&P 500 ETF), VOO (Vanguard S&P 500 ETF) and IVV (iShares Core S&P 500 ETF) took in a combined $6.7 billion (courtesy of ETF.com). In the same week, US-based equity funds pulled in $3.1 billion. In the prior week, $25.2 billion was redeemed, which was the highest weekly loss since $34.6 billion was withdrawn in the week through December 19 last year – a week before stocks put in important lows (courtesy of Lipper).
Euro: Currently net short 46.6k, up 2.6k.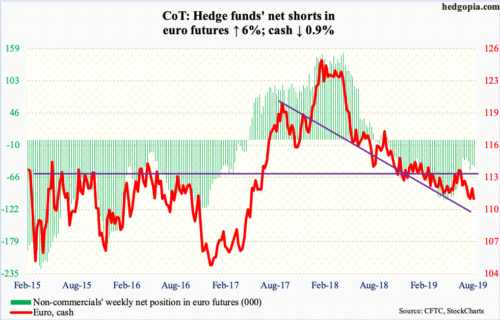
Resistance just north of $112, which approximated the 50-day at $112.32, persistently came in the way of euro bulls early this week. Resistance is stiffer at $113. The 200-day ($112.94) lies there as well. Intraday Friday, the currency dropped to $110.64 but managed to reclaim $111 by close. The cash ($111.06) can come under pressure near term. The daily MACD just completed a potentially bearish cross-under.
Gold: Currently net long 290.1k, down 2.5k.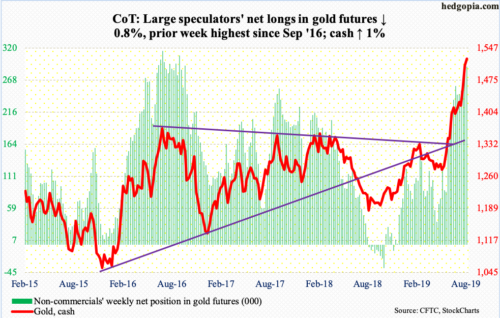
In the week ended Wednesday, for the first time in 13 weeks, GLD (SPDR Gold ETF) experienced outflows, as $46 million was withdrawn. In the prior 12, it took in $5 billion. In the same week, IAU (iShares Gold Trust) gained $173 million – its 8th positive week in nine (courtesy of ETF.com).
The cash ($1,523.60/ounce) continued its upward momentum, although the weekly formed a spinning top. The intraday high this week of $1,546.10 ran into horizontal resistance from 2011-2013. Back then, gold peaked at record $1,923.70 in September 2011, but began to come under severe pressure after it lost $1,540s-50s. This level is worth watching.
Nasdaq 100 index (mini): Currently net long 24.2k, down 14.8k.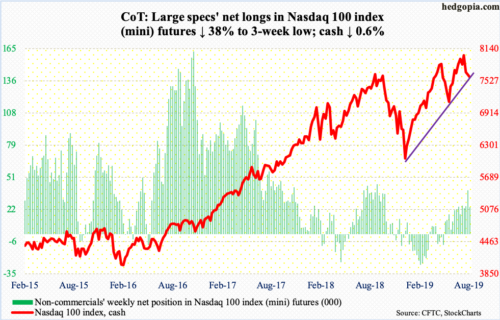
For the second week running, bulls defended trend-line support from last December’s lows. Last week’s low was 7356.27, this week’s 7429.36. The cash (7604.11) remains trapped between the 50- and 200-day (7728.73 and 7232.40, in that order). If the 200-day gets tested, bulls would have lost the trend line in question. Hence the significance of whether bulls or bears come out on top in the next few sessions. Bulls would have substantially raised their chances should they take out 7700/200-day. They are probably happy with how flows behaved in the week to Wednesday, as QQQ (Invesco QQQ Trust) gained $2.1 billion (courtesy of ETF.com).
Russell 2000 mini-index: Currently net short 66.9k, down 12.5k.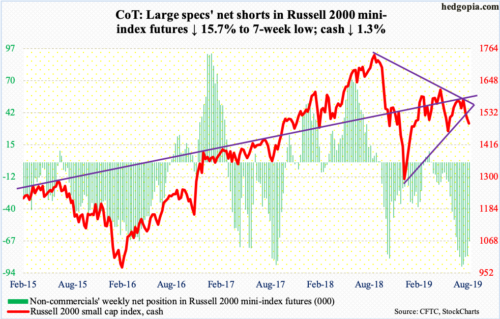
The cash (1493.64) Thursday made an intraday low of 1456.28, slightly breaching the lows from early June. During the recent three-week selling, of the major US equity indices, the Russell 2000 is the only one to have done so. It is below the 50- and 200-day. The daily is oversold, which gives the index an opportunity to lift off of support at 1450s. Small-cap bulls cannot afford to lose this.
In the week ended Wednesday, IWM (iShares Russell 2000 ETF) attracted $694 million, while IJR (iShares Core S&P Small-Cap ETF) lost $77 million (courtesy of ETF.com).
US Dollar Index: Currently net long 29.8k, down 1.5k.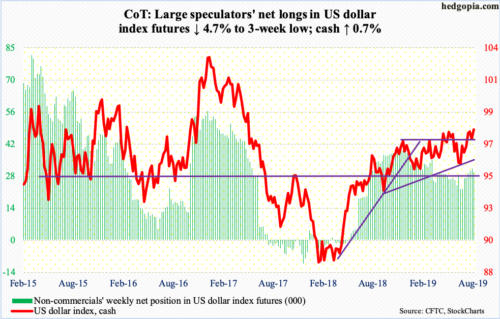
Dollar bulls put their foot down this week, recapturing 97.50s. The cash (98.01) has room to continue higher on the daily chart. In this scenario, the August 1st intraday high of 98.70 has gained in significance.
The action this week is interesting considering that in the fed funds futures market traders continue to price in two more 25-basis-point cuts this year, one each in September and October, even as the 10-year Treasury yield dipped below 1.5 percent this week. It is too soon to conclude but it is possible the US dollar index has priced all this in. In this scenario, the path of least resistance is up – timing and duration notwithstanding.
VIX: Currently net short 71.4k, down 9.2k.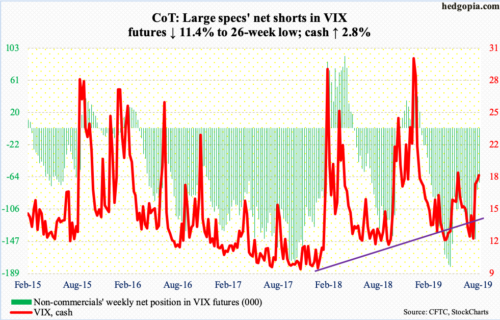
Thursday’s intraday high of 24.10 fell slightly short of the August 5th intraday high of 24.81. Both these weeks ended with a long tail on the weekly candle. This opens up opportunity for volatility bears to push the cash (18.47) lower, at least near term. The 200-day at 17.07 lines up with horizontal support at 16-17. After that comes the now-slightly-rising 50-day (15.53), which approximates support at 14-15.
Concurrently, the 21-day moving average of the CBOE equity-only put-to-call ratio ended the week at 0.723, up from 0.598 on July 17. This metric is beginning to get way elevated, unwinding of which will help stocks. On June 5, the ratio peaked at 0.706; stocks rallied in all of June and most of July.


