
Commitment Of Traders, Futures And Hedge Fund Positions, Sunday Jan. 24
Following futures positions of non-commercials are as of January 19, 2021.
10-year note: Currently net long 46.6k, up 96.8k.
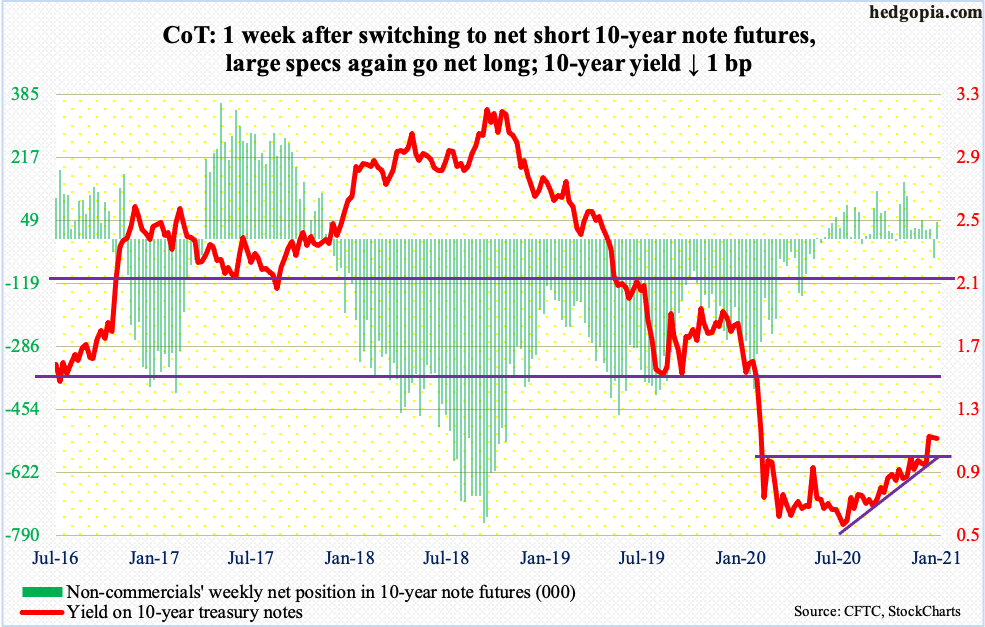
A two-day FOMC meeting begins on Tuesday. This is the first meeting of the year – one of the eight scheduled meetings. Markets do not expect any firework. They know what to expect.
Speaking to the press at the end of the December 15-16 meeting, Chair Jerome Powell said they would purchase $120 billion/month in mortgage-backed securities and treasury notes and bonds. The 10-year treasury notes yielded just under one percent back then. Then came Georgia Senate runoff elections held on the 5th this month. Democrats won both seats, giving them control of both chambers of Congress as well as the White House. Markets immediately rerated inflation/growth expectations. On the 6th, the 10-year (1.09 percent) broke out of one percent. This was 12 sessions ago. Some market participants began to wonder if the Fed still needed to support this market.
The central bank responded. Last week, several Fed officials, including Powell and Vice Chair Richard Clarida, made it clear they intend to continue to buy these securities. At the current pace, they are on course to owning $6.8 trillion worth in six months, from the current $6.1 trillion (as of Wednesday this week). If anything, next week, they will reiterate their commitment.
Because of the leverage in the system – be it federal, corporate and household – their hands are tied. They cannot afford to let rates rise on a sustained basis. If nothing else, interest payments will break the back of borrowers (more on this here). The Fed will do all it can to maintain the status quo.
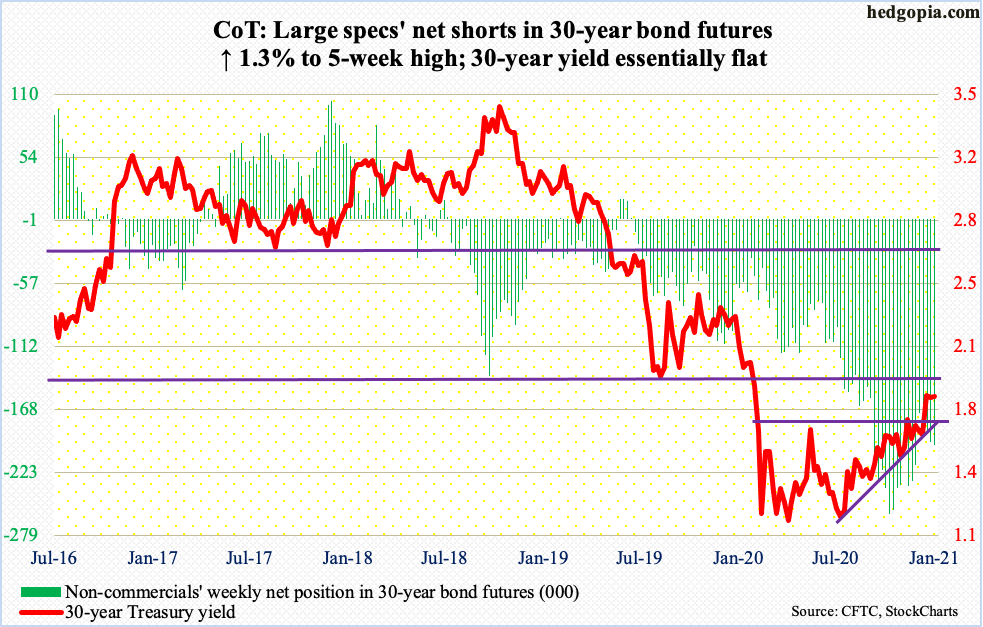
30-year bond: Currently net short 199k, up 2.6k.
Major economic releases for next week are as follows.
The S&P Case-Shiller Home Price Index (November) is due out Tuesday. In October, US home prices jumped 8.4 percent year-over-year – the fastest pace since March 2014.
Durable goods orders (December) will be published Wednesday. November orders for non-defense capital goods ex-aircraft – proxy for business capex plans – increased 6.8 percent y/y to a seasonally adjusted annual rate of $71 billion – a new record. In April, sales languished at $61.3 billion.
GDP (4Q20, 1st print) and new home sales (December) come out Thursday.
In 3Q, Real GDP shot up 33.4 percent at an annualized rate. This followed contraction of five percent in 1Q and 31.4 percent in 2Q. The Atlanta Fed’s GDPNow model forecasts 7.5 percent growth in 4Q.
Sales of new homes tumbled 11 percent m/m in November to 841,000 units (SAAR). July’s 979,000 was the highest since December 2006.
Friday brings the employment cost index (4Q20), personal income/spending (December) and the University of Michigan’s consumer sentiment index (January, final).
Compensation costs for private industry workers rose 2.4 percent in the 12 months to September. This was the slowest growth rate in 13 quarters.
In the 12 months to November, core PCE (personal consumption expenditures), which is the Fed’s favorite measure of consumer inflation, rose 1.39 percent. This was the slowest pace in four months. The last time core PCE grew with a two handle was December 2018.
Consumer sentiment dropped 1.5 points m/m in December to 79.2. Sentiment dropped to 71.8 in April before recovering, but was 101 in February.
WTI crude oil: Currently net long 555.5k, down 9.8k.
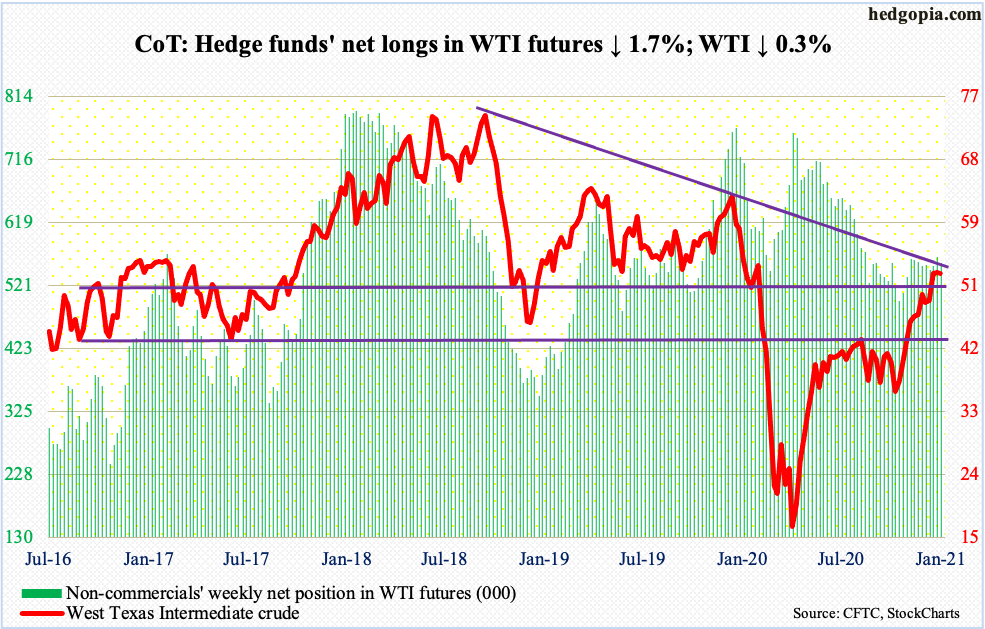
Oil bulls defended the 10-day moving average in the first three trading sessions but only to lose it on Friday. All along, they were unable to take out last week’s doji high. Since posting $53.93 intraday on the 13th, WTI ($52.27/barrel) has essentially gone sideways, with rising risks of downward pressure. A weekly doji formed both this week and last. This preceded a break two weeks ago out of horizontal resistance at $49-$50. Even before that, in late November, the crude took out $42-$43.
WTI has had quite a move since last March. Conditions are overbought. And, both this week and last, the highs kissed a falling trend line from October 2018 and retreated. In the event of a pullback – likely – what transpires at $49-$50 will be telling.
E-mini S&P 500: Currently net short 1.9k, down 15.7k.
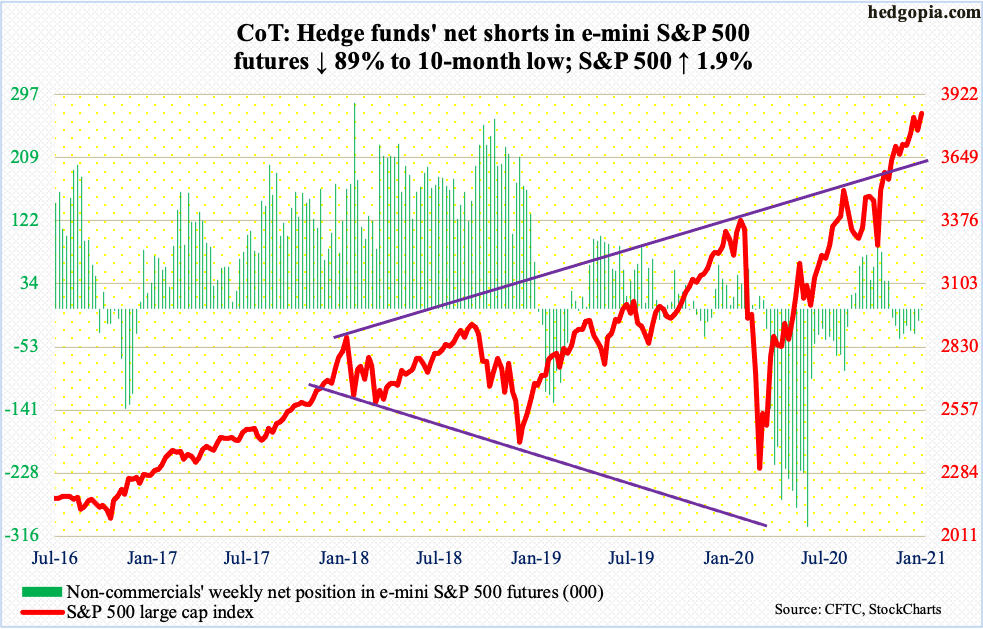
Bears – once again – were unable to cash in on a potentially bearish weekly hanging man from two weeks ago. Last week’s mini selloff stopped right at the 20-day. This week, the S&P 500 (3841.47) rallied 1.9 percent, to a new intraday high of 3861.45 notched on Thursday.
Bulls now have new short-term support at 3820s, and 3740s after that. In the week to Wednesday, they sent in $3.6 billion to US-based stock funds. This comes on the heels of inflows of $5.4 billion in the prior week (courtesy of Lipper).
In the meantime, it turns out foreigners bought $61.9 billion in US stocks in November. The S&P 500 jumped 10.8 percent in that month. In the 12 months to November, they accumulated $316.2 billion worth – a record (chart here). Margin debt is another metric that is in uncharted territory (chart here).
Despite the prevailing ‘this time is different’ attitude, which historically has always come back to bite them in the rear, bulls have done a good job of defending support. Last month, they quickly stepped up to defend 3640s. On November 9 when Pfizer (PFE) announced its positive vaccine news and stocks rallied, the large cap index reversed to close 95 points lower from the intraday high of 3645.99. Bulls deserve the benefit of the doubt as long as 3640s is intact, which is 200 points lower from here.
Euro: Currently net long 163.5k, up 7.6k.
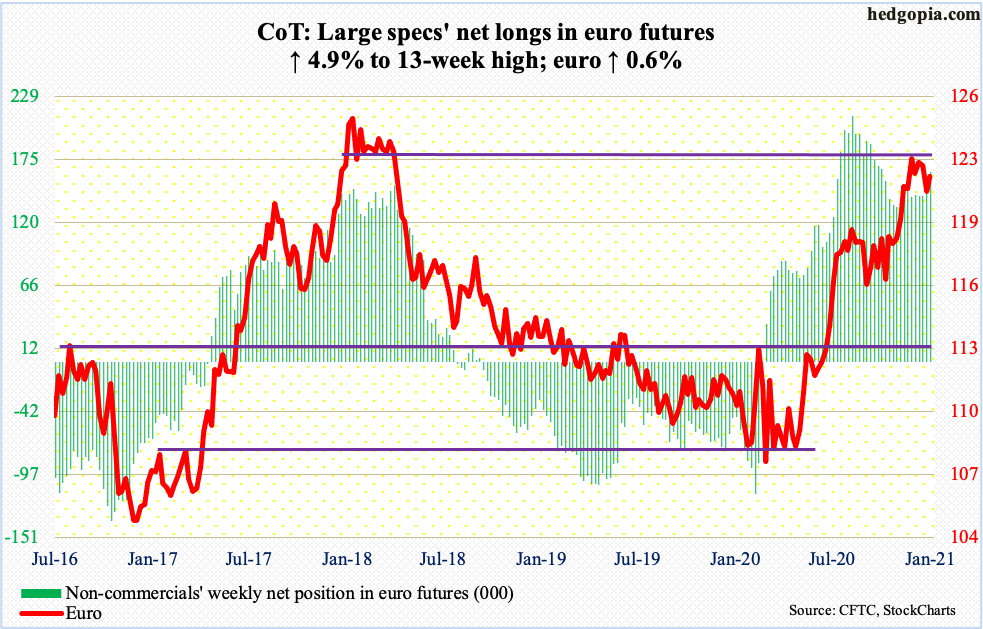
On Thursday, as widely anticipated, the ECB left its interest rates unchanged. President Christine Lagarde stressed on the need to become flexible, stating that the €1.85-trillion pandemic emergency purchase program may not be fully used but also saying it can be equally recalibrated should the need arise. Markets latched on to the first comment and rallied the euro ($1.2175) 0.5 percent in that session.
Leading up to this, in Wednesday’s doji session, the currency tagged the 50-day. Tuesday produced a doji as well.
On the 6th, the euro tagged $1.2345 intraday before reversing. The resistance-turned-support at $1.20-$1.21 was not quite tested, but this was a first test of the 50-day in the past couple of months and it held. Bulls’ real test will be if they can take out $1.2170s. Non-commercials are betting this happens.
Gold: Currently net long 246.6k, up 411.
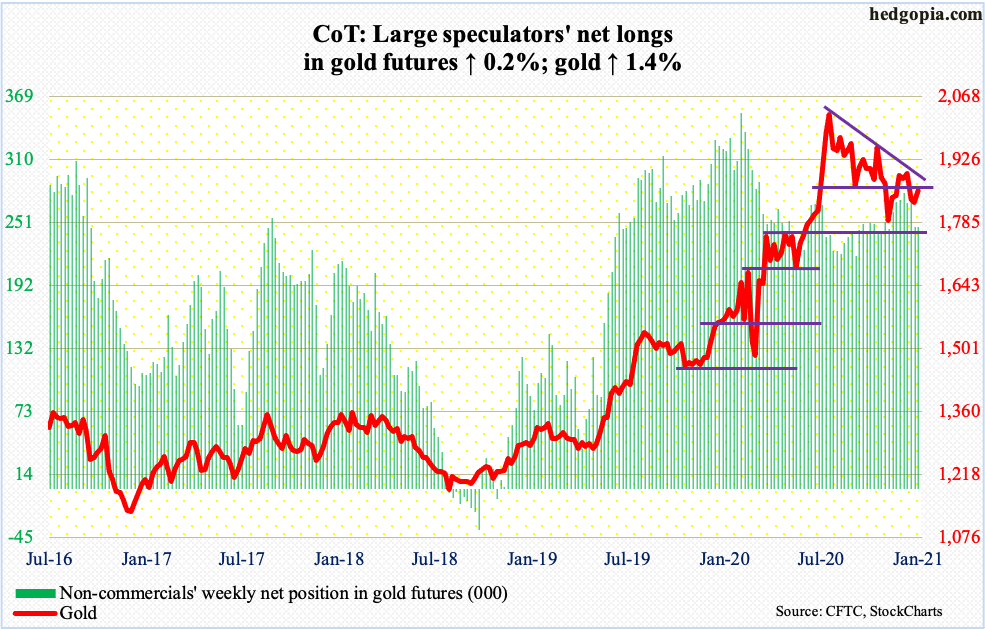
On Tuesday, bids showed up well ahead of a test of straight-line support at $1,760s-$1,770s, as gold ($1,856.20/ounce) tagged $1,800.80 intraday, leaving behind a long lower shadow. In the next session, the 200-day ($1,848.90) was recaptured.
For the metal to proceed toward testing crucial $1,920s, which is where gold peaked in September 2011, it first needs to take care of trend-line resistance from early August. This was tested – unsuccessfully. Inability to reclaim this trend line raises the odds the descending triangle gold finds itself in completes in due course, meaning the risk is to the downside. It currently sits right on that support.
Nasdaq 100 index (mini): Currently net long 31.6k, up 11.2k.
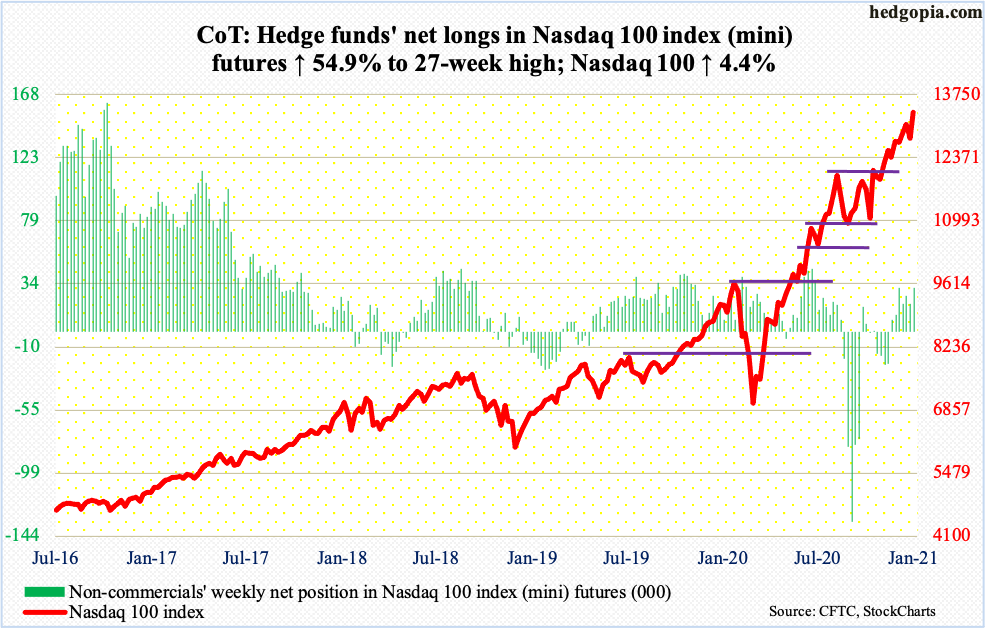
Tech investors rallied the Nasdaq 100 4.4 percent this week positioning for December-quarter results from tech bigwigs the next couple of weeks. This follows a weekly hanging man from two weeks ago, which the bears – once again – were unable to capitalize on. On Thursday, the index tagged a new intraday all-time high of 13433.69.
That said, bulls probably were not happy how Intel (INTC), IBM (IBM) and Seagate (STX) were treated post-earnings on Friday.
Nearest support on Nasdaq 100 (13366.40) lies at 13000.
Russell 2000 mini-index: Currently net long 449, down 14.6k.
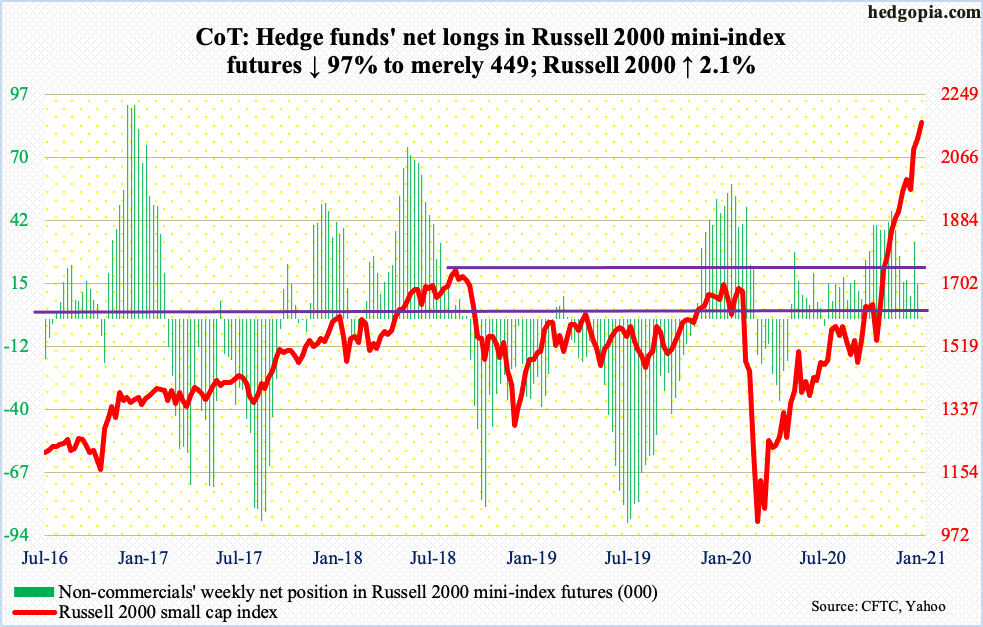
Small-cap bulls were simply not ready to lose the 10-day on the Russell 2000 (2168.76). The average was breached intraday Friday but was aggressively bought.
Amidst this, increasingly it feels like some level of profit-taking is taking place, which at this stage of the game is normal. The index more than doubled from last March.
Immediately ahead, there is support at 2110s, and at 2020s after that.
US Dollar Index: Currently net short 14.3k, up 370.
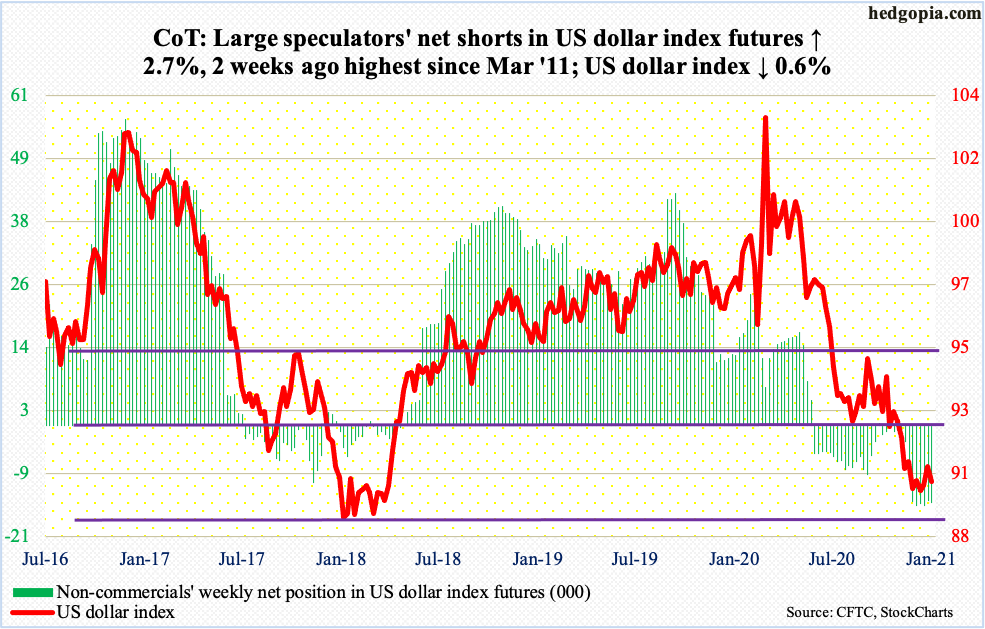
Dollar bulls ran out of steam. After bottoming intraday at 89.17 on the 6th, the US dollar index (90.21) quickly rallied toward horizontal resistance at 90.50s. After several unsuccessful attempts, bulls now probably need to regroup.
From their perspective, the good thing is that they have managed to defend 88-89, which goes back to at least March 2004. Dynamics change if this level is breached.
VIX: Currently net short 124.5k, up 6.9k.
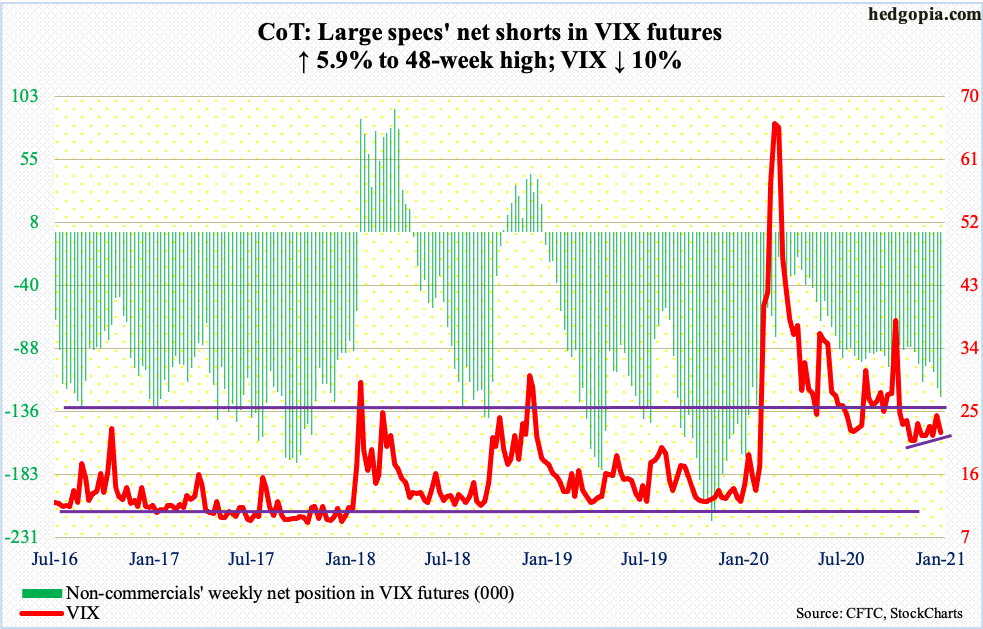
VIX (21.91) closed under a rising trend line from late November on Thursday but only to reclaim it on Friday, but barely. Thursday’s intraday low of 21.09 was yet another instance since late November of a successful test of 20-21.
From volatility bulls’ perspective, the problem has been their inability in recent weeks to sustain above mid-20s. That said, the consolation is that the 50-day is no longer dropping, rather trying to go sideways.
In the meantime, calls continue to exceed puts by a wide margin. The 10-day average of the CBOE equity-only put-to-call ratio on Wednesday made a fresh low of 0.388. Historically, the ratio tended to bottom in the low-0.50s, and high-0.40s occasionally. This time around, it has persistently remained in the 0.40s since November 13, eight of them in the 0.30s, including Wednesday through Friday this week (chart here). Optimism is dangerously lop-sided.


