
Commitment Of Traders, Futures And Hedge Fund Positions - Sunday, Jan. 10
Following futures positions of non-commercials are as of January 5, 2021.
10-year note: Currently net long 27.7k, up 2.4k.
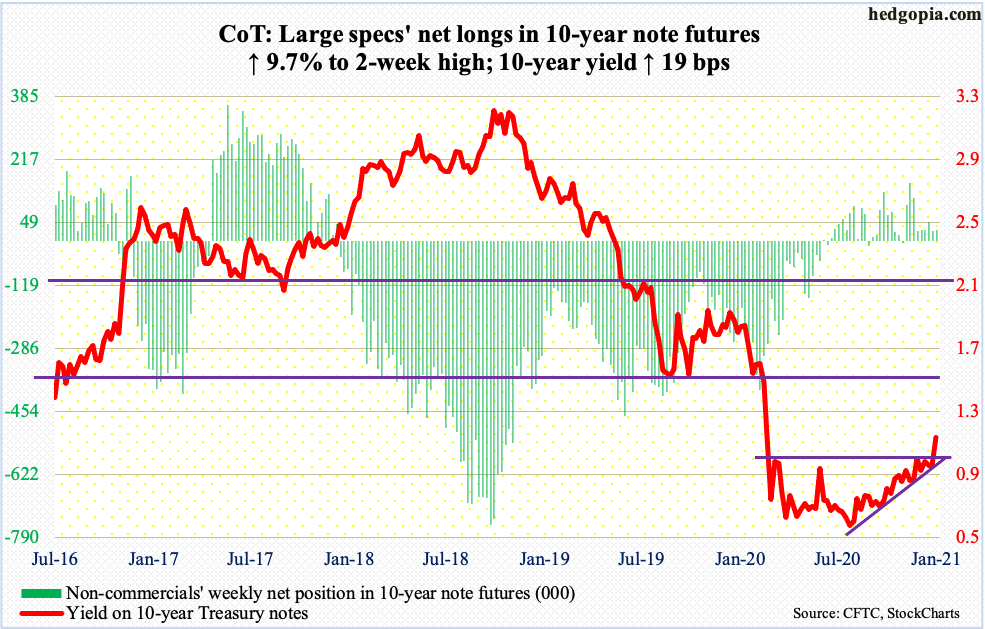
After losing one percent last March, bond bears (on price) had been unable to reclaim the level. That ended Wednesday when Democrats won two Georgia Senate runoff elections, forcing bond vigilantes to rerate inflation/growth expectations.
On Wednesday, the 10-year treasury yield rallied nine basis points to 1.04 percent, ending the week at 1.11 percent, up 19 basis points. As long as one percent is not breached, the path of least resistance is toward 1.4 percent (more on this here).
With the win in Georgia, Democrats now control the Senate, the House and the White House, raising the probability that President-elect Joe Biden will have an easier time to push through a bigger stimulus package, not to mention big infrastructure spending.
The bigger question is the Fed’s reaction function. In a leveraged economy – be it on the federal, corporate or household level – higher rates can set in motion a cascading effect, especially if they rise too quickly. If the 10-year does indeed march toward 1.4 percent, and then two percent, it would not be long before the Fed begins to intervene – first verbally and then by action.
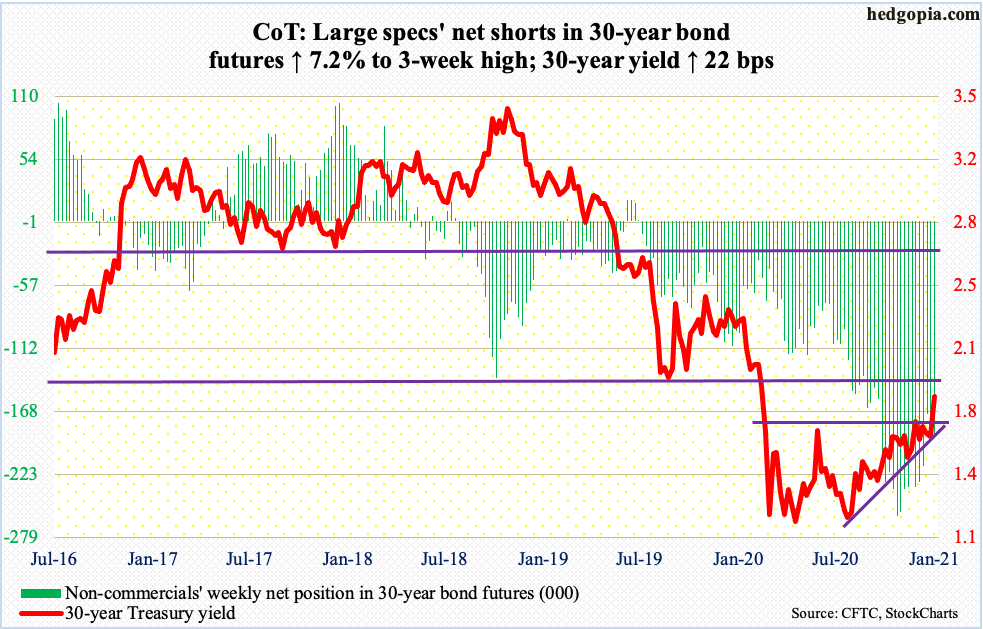
30-year bond: Currently net short 187.6k, up 12.6k.
Major economic releases for next week are as follows.
The NFIB Optimism Index (December) and JOLTS (November) are due out Tuesday.
NFIB job openings inched up a point month-over-month in November to 34. The metric was down to 23 in May. Earlier, it hit record 39 three times between December 2018 and July 2019.
Non-farm job openings increased 158,000 m/m in October to 6.65 million. Openings languished at five million in April, having earlier peaked at 7.52 million in January 2019.
The consumer price index (December) is scheduled for Wednesday. In November, consumer prices inched up 0.2 percent both m/m and year-over-year. Core CPI rose 1.2 percent m/m in November and 1.6 percent in the 12 months to November.
Friday brings retail sales (December), industrial production (December) and the University of Michigan’s consumer sentiment index (January, preliminary).
Retail sales fell 1.1 percent m/m in November to a seasonally adjusted annual rate of $546.5 billion. This was the second straight m/m drop after reaching $552.8 billion in September – a record. In April, sales were $412.8 billion.
Capacity utilization declined 5.5 percent y/y to 73.3 percent in November. This was an eight-month high after having dropped to 64.2 percent in April.
Consumer sentiment increased 3.8 points m/m in December to 80.7. Sentiment was 101 in February, before tumbling to 71.8 in April and reaching 81.8 in October.
WTI crude oil: Currently net long 550k, up 5.6k.
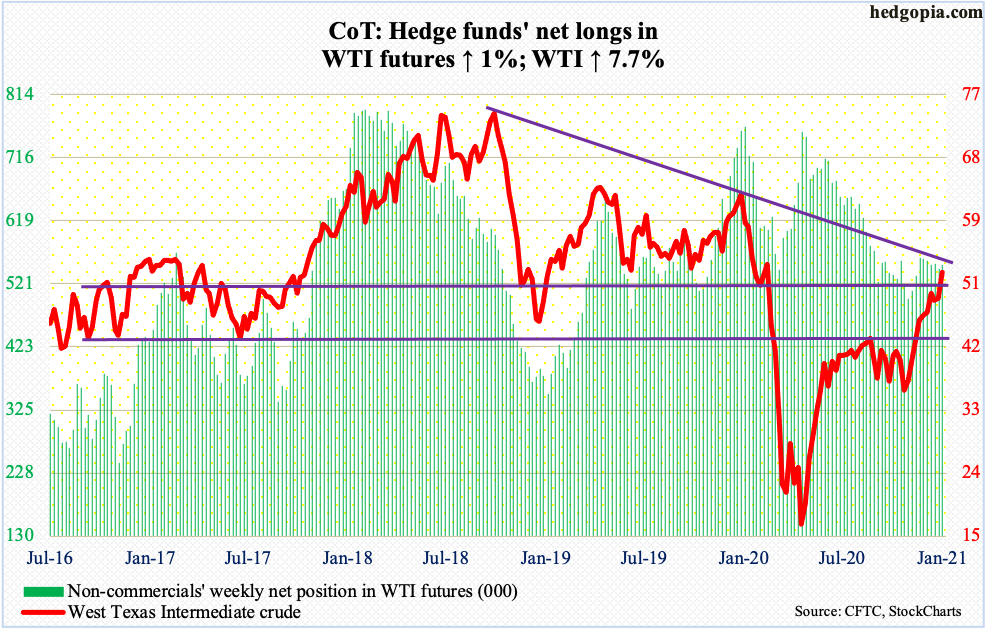
Tuesday’s surprise announcement by Saudi Arabia to reduce its oil production by one million barrels a day in February and March caught the oil market by surprise. Russia was demanding an output increase by the OPEC+ group. Saudi Arabia’s decision will result in an overall reduction in oil production. The difficulty in reaching a consensus is laying bare the simmering tension between Saudi Arabia and Russia. For now, oil bulls seized on the output cut aspect. Brent shot up 5.8 percent on Tuesday and WTI ($52.24/barrel) 4.9 percent. The latter is past horizontal resistance at $49-$50, sitting just below trend-line resistance from October 2018.
Leading up to this week’s 7.7-percent rally, WTI broke out of $42-$43 seven weeks ago. Conditions remain overbought, but they have been that way for a few weeks now. In the event profit-taking takes place, there is support at $49.40s.
In the meantime, EIA data show that in the week to January 1 US crude production was unchanged at 11 mb/d. Crude imports rose 43,000 to 5.4 mb/d. As did stocks of gasoline and distillates, which were respectively up 4.5 million barrels and 6.4 million barrels to 241.1 million barrels and 158.4 million barrels. Crude stocks, however, declined eight million barrels to 485.5 million barrels – a nine-week low. Refinery utilization increased 1.3 percentage points to 80.7 percent.
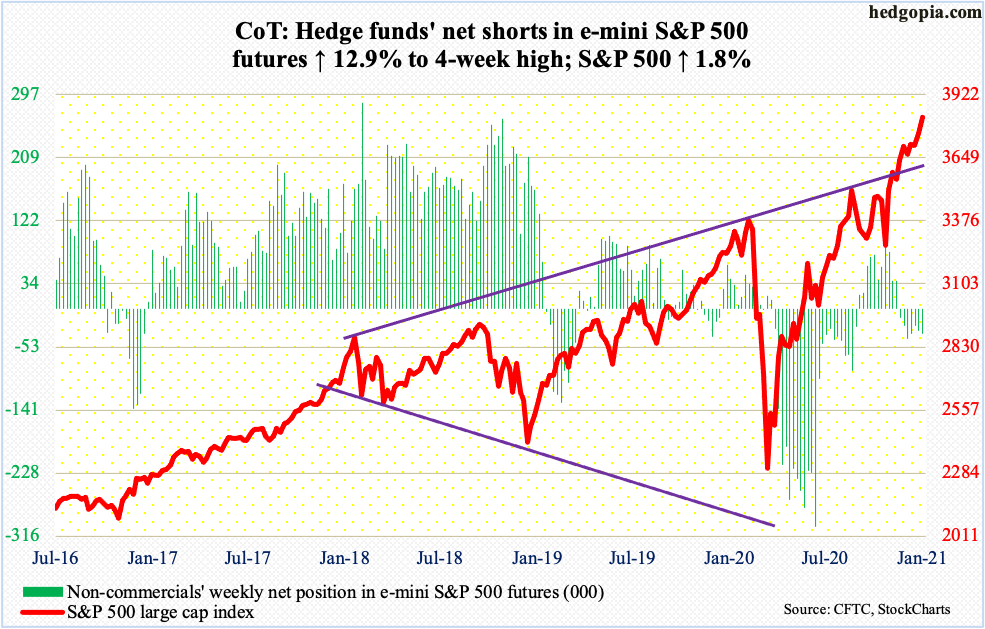
E-mini S&P 500: Currently net short 34.8k, up 4k.

From Monday’s intraday low of 3662.71 through Friday’s high, the S&P 500 jumped 4.5 percent. Bids showed up Monday before 3640s was tested; this was the high set on November 9 when Pfizer (PFE) announced its positive vaccine news and has been defended several times since. Just below, at 3580s, lies another important level; this was the high reached on September 2. As long as the large cap index (3824.68) remains above these two zones, momentum remains with the bulls.
After Monday’s drop, the index rallied in each of the remaining four sessions, ending the week at a new high. As a result, the weekly ended up with a potentially bearish hanging man, which also formed on Friday’s chart. This pattern needs confirmation. Next week’s action will be important.
Euro: Currently net long 143k, down 85.
Before ending with a hanging man, the euro ($1.2221) on Wednesday rallied to $1.2345. This was the highest intraday print since April 2018. The currency remains above horizontal resistance-turned-support at $1.20-$1.21, which was taken out in early December. This level approximates the 50-day at $1.2019. In the event of a pullback, which is looking likely, this is where bulls and bears will lock horns.
Gold: Currently net long 279.3k, up 10.4k.
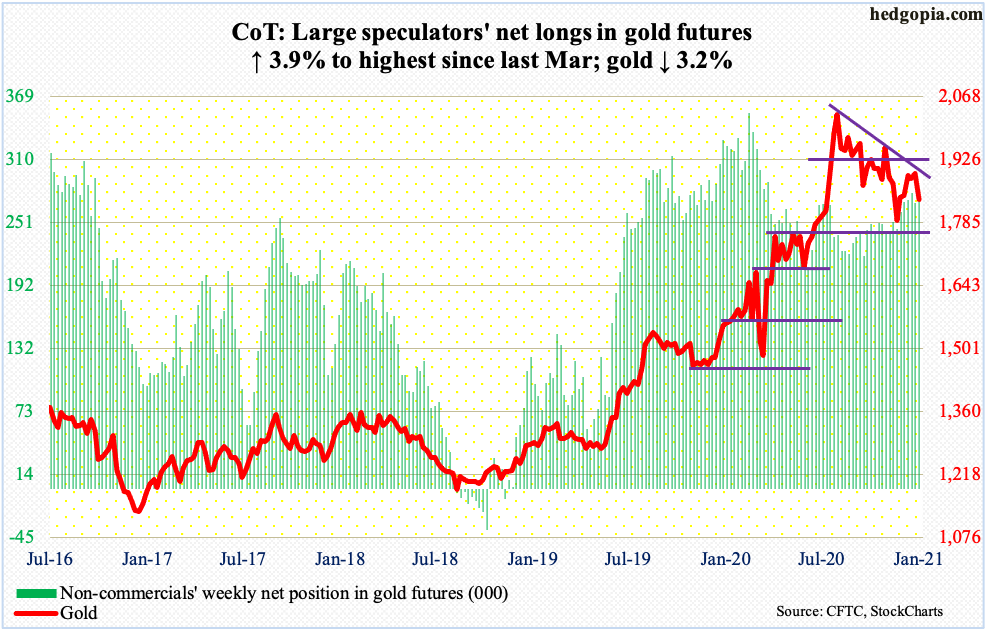
No sooner did gold bugs achieved an important breakout than they were unable to save it. On Monday, gold ($1,835.40/ounce) rallied 2.7 percent to not only reclaim a falling trend line from last August when it peaked at $2,089.20 but also $1,920s. The latter is where the metal peaked back in September 2011, before dropping to $1,045.40 by December 2015. Bulls had to wait until last July to take out that old high, with the move culminating in August. The drop since bottomed at $1,760s in late November.
From that low, gold persistently made higher lows, with the 10-day in particular providing support. The streak ended Friday when the yellow metal collapsed 4.1 percent, piercing through the 50-day, horizontal support at $1,850s as well as the 200-day ($1,839.58). Support at $1,760s has now taken on significance.
Nasdaq 100 index (mini): Currently net long 25.8k, up 6k.
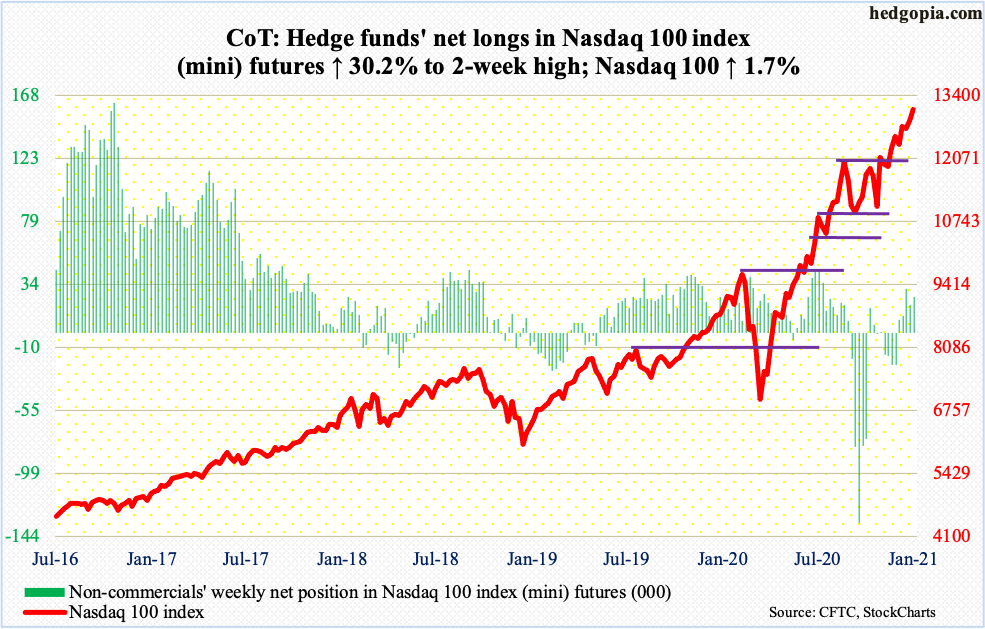
The Nasdaq 100 (13105.20) opened the week with an intraday loss of 2.7 percent at Monday’s low, which was bought hand over fist. By the time the week was over, the index was up 4.6 percent from that low. Friday produced a hanging man on the daily; the pattern also formed on the weekly. This is potentially bearish but needs confirmation.
Immediately ahead, there is support at 12950s.
In the week to Wednesday, QQQ (Invesco QQQ Trust) saw outflows of $2.11 billion, reversing cumulative inflows of $2.08 billion in the prior two weeks (courtesy of ETF.com).
Russell 2000 mini-index: Currently net long 33k, up 23.2k.
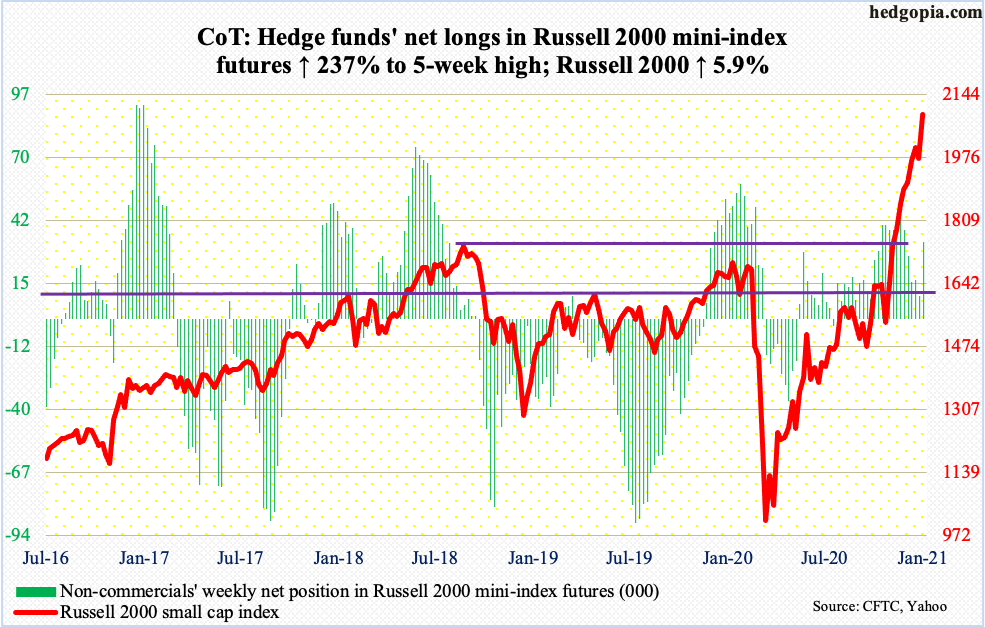
After defending 1920s intraday Monday, small-cap bulls went on a rampage, hitting 2113.88 intraday Friday. After Georgia’s election results, markets are hoping for big stimulus and infrastructure spending under the Biden administration. By nature, small-cap companies have larger domestic exposure than their larger-cap peers. Hence investor preference for these names.
The Russell 2000 (2091.66) surged 5.9 percent for the week. Last March, it bottomed at 960s, and was at 1530s late October/early November. Between then and now, it not only broke through 1600-plus, which goes back to January 2018, but also 1740s, which was the high reached in August that year.
Friday, the small cap index was 36.1 percent above its 200-day, just below record 36.9 percent recorded in the prior session. As extended as the Russell 2000 is, bulls keep surprising on the upside, although they were unable to hang on to Friday’s new high, with the session ending with a spinning top.
With this week’s mini-breakout, bulls now have new support at 2010s.
US Dollar Index: Currently net short 15k, up 395.
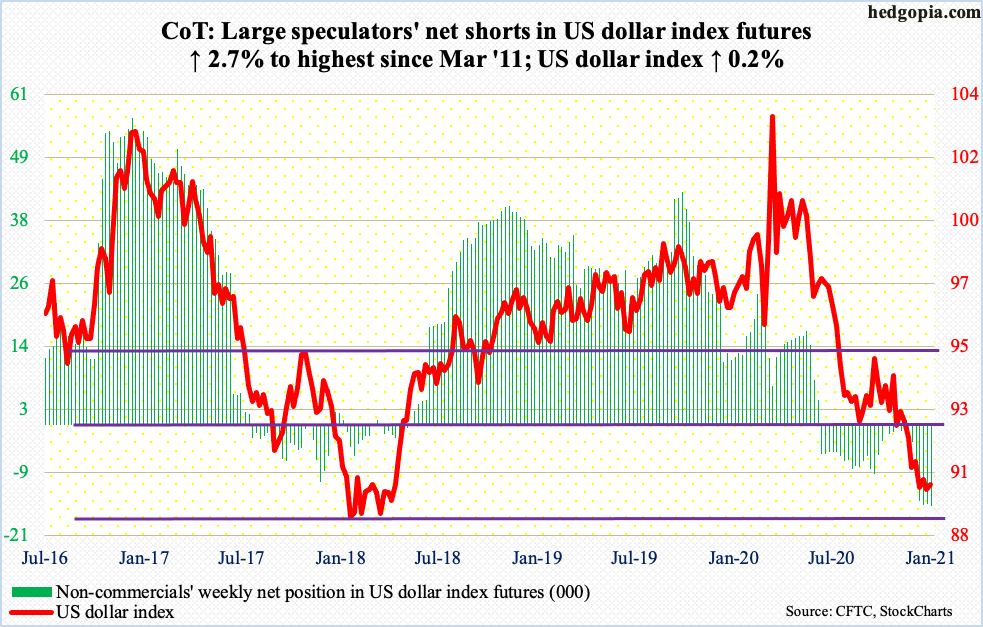
A weekly hammer showed up this week, but not before the US dollar index (90.07) dropped to 89.17 in Wednesday’s spinning top session. This was the lowest since April 2018. Before this, Monday saw a daily hammer and a bullish engulfing last Thursday.
Dollar bulls are trying to put their foot down near 88-89, which goes back to at least March 2004. The dollar index traded as high as 103.96 last March, meaning it is caught in a 10-month downtrend. The daily is itching to break free.
Friday, the dollar index edged past nearest resistance at 90. Next comes 90.50s, followed by crucial 92, which was lost in late November.
VIX: Currently net short 106.1k, up 7.5k.
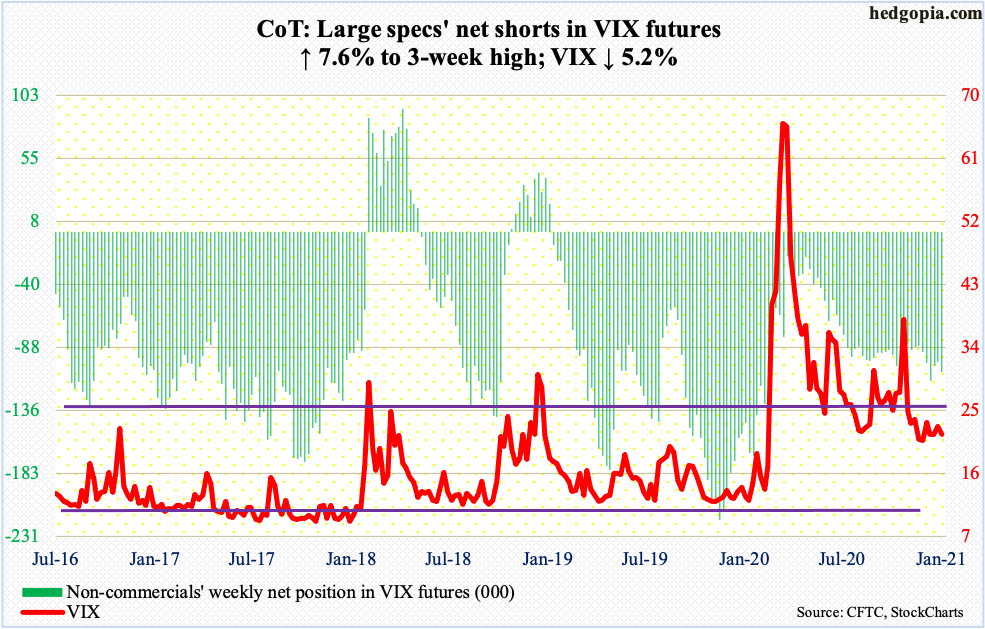
December produced a nasty-looking monthly shooting star. January is young, but it too is on course for a shooting star. Monday, which was the first trading session of the year, VIX jumped to 29.19 intraday, before collapsing in the next four sessions, reaching 21.42 intraday Friday.
Monday’s high was denied just short of the 200-day. The average also stopped a rally attempt on December 21 when VIX surged to 31.46 intraday but only to close at 25.16. Around 21.50 lies rising-trend-line support from late November. A breach opens the door to a test of low-20s. Since late February last year, VIX (21.56) has not violated this level.
This blog is not intended to be, nor shall it be construed as, investment advice. Neither the information nor any opinion expressed here constitutes an offer to buy or sell any security or ...
more

