
Clouds Are Parting And Some Clarity Appears For Investors
After a significant 1-week drawdown (read last week's Report here) in the major averages 2 weeks ago, the market had an even greater resurgence this past trading week. The equity markets may have caught a great many investors by surprise, but for those who "stayed the course", remained unbiased and flexible, these are the traders/investors who proved the beneficiaries of a greater than 7% rally in the S&P 500 (SPX).
The Nasdaq (COMP) was the clear winner this past trading week, rallying 9%, while the Dow Jones Industrial Average (DJI) and Russell 2000 (RUT) both rose 6.8% for the week. Both small-cap and large-cap stocks rallied this past week, indicating that breadth dramatically improved from depressing and dangerous levels the prior week. There will be many ways to characterize the last 2 trading weeks with opposing adjectives when weighing the decline against the subsequent advance. We think the best way to view the sum of the 2-week move is to remember that buying the dip is still the trend, even if it stretched the timing for which the dip buyers would engage once again.
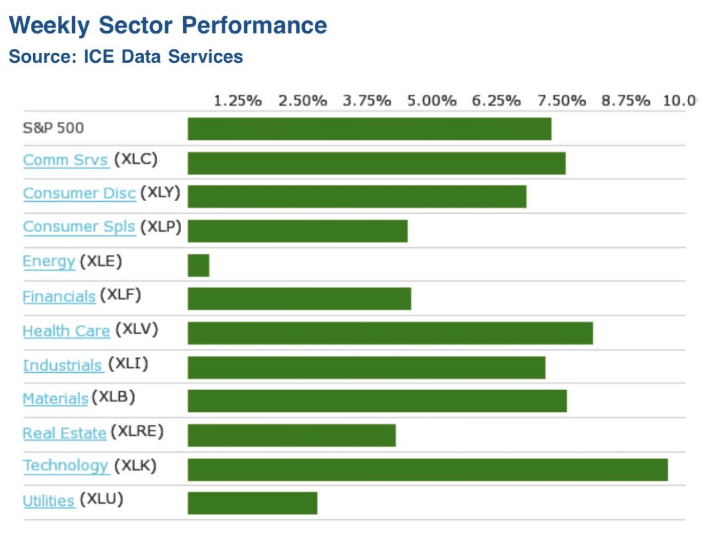
The weekly sector performance identifies that not only was buying the dip afoot this past week, but risk-on appetite underscored the price action. Growth and Cyclicals led the market higher while Value and Defensive sectors lagged, although proving to ride the buying wave higher nonetheless. It's a sharp contrast to the weekly sector performance we identified in the prior week and as revisited below:
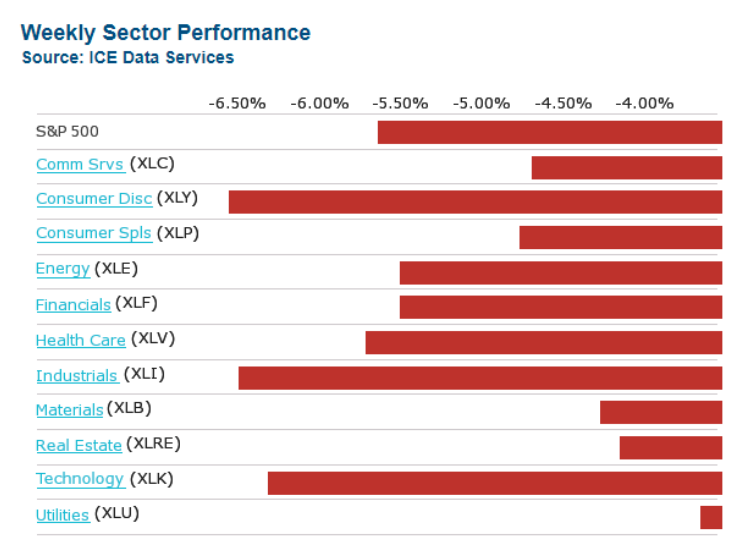
From Deep red to Forest green; just like that! In that color change emphasizing green, it proves relevant once again to recognize all the trees placed along the pathway, within the great big forest that is the economy and marketplace. If we don't let the trees impede our recognition of the forest or long-term investing goals, the more achievable our goals become. With that, and as we dive into Finom Group's (for who I am employed) technical analysis, I encourage investors to continue with the following disciplines:
- Review your investing/trading process/es.
- Recognize your current game plan and what it involves; macro, technical, and course-correcting if necessary.
- Don't forget to build resources.
- Adhere to your disciplines, but be flexible when the market is signaling faults in your discipline.
- A quarterly checklist provides a great view of your portfolio landscape.
- Remember, the market will travel higher due to earnings growth and structural shifts in the indices themselves. This is a primer for your long-term positioning.
S&P 500 Packed A Punch
The market has an uncanny way of weeding out the weak from the strong. The reality is most traders don't require this action of the market, but rather a rigid belief of the future path of the market that proves to be their own undoing. While the market appeared on the verge of breaking key levels of support and firing a bearish breadth thrust as of October 30th, one-week later the market appears on the verge of a breakout, with a bullish breadth thrust. We'll dive into the latter state of markets and market internals in a bit, but what the market has done in the last 2 weeks should reinforce the understanding that one needs to always maintain an unbiased and flexible market approach to investing and trading.
“Trading doesn't just reveal your character, it also builds it if you stay in the game long enough.” ― Yvan Byeajee
The S&P 500 chart depicted below was taken as of October 31st and at the completion of the former trading week. There's little in the way of optimism that most could glean from the chart below.
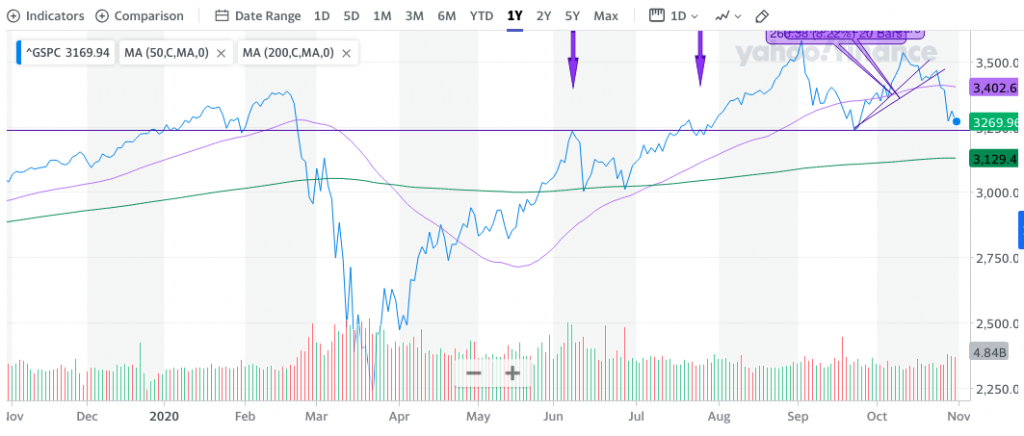
"The inverse Head-N-Shoulder pattern is rather clear in the chart above (right side), having first developed the left and head of the pattern in September and then the right should into October. The base, or low point, of the head comes in at SPX 3,230s back on September 23, 2020. Thus far, the base continues to hold, providing long-term support as recognized by the horizontal (purple) line and dating all the way back to December 2019. During the S&P 500’s recovery process, this area 3,230-3,240 proved resistance, but since then it has provided support during consolidation phases. Despite the current bouts of increased market volatility (VIX), this remains a normal correction until proven otherwise. Like most everything else in the market; it is a developing situation for which an unbiased, flexible approach to allocating capital is the optimal engagement."
Staying flexible and recognizing there is no such thing as "the end" of the market but always a "developing" market condition enforces the premise that remaining unbiased and flexible is the absolute best course of action for investors/traders. If you should find yourself anxious over the course of any weekend, and given the unfavorable developing chart depicted on October 31st, here are a few things to consider:
- I may have taken more risk than I am comfortable taking.
- I may need to review my game plan and make some changes to align with the long-term probabilities, as the near-term issues are weighing on my investor psychology.
- Am I communicating my concerns with my team of resources, to better recognize the risk vs. reward in the market?
With the S&P 500 chart from October 31st potentially pointing to further deterioration, the market made a complete pivot starting this past Monday. This day proved to highlight the relevance of understanding the historic data as well.
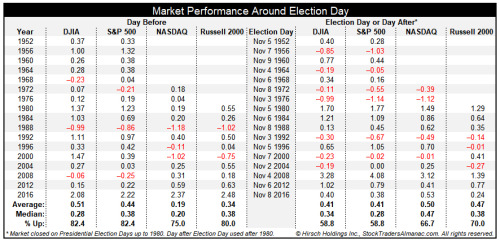
- Looking back at the last seventeen presidential elections since 1952, the day before Election Day has a clear bullish bias. DJIA and S&P 500 have declined just 3 times and average gains of 0.51% and 0.44% respectively.
- Nasdaq and Russell 2000 are slightly weaker, but still bullish.
- Election Day (or the day after prior to 1980) leans bullish, but with a greater frequency of losses. Incumbent party victories are shaded in light grey.
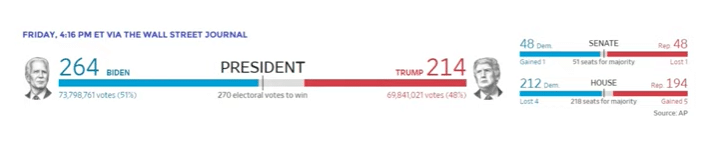
The day before the election, the market held very true to its historic performance, even outperformed with a gain of more than 1.2% Monday. Even if the election itself hasn't been declared for a victor as of Saturday November 7th, the market has concluded that the varied scenarios of a Trump or Biden victory are acceptable going forward. A Trump victory brings about a market that understands the tax regime will remain and COVID lockdowns will have limitations. A Biden victory may prove continued divided government, which is also status quo. However, there does remain a chance that the Democrats can pull off control of the Senate and if that does occur, I am sure we will see the stock market re-evaluated and re-rated if that starts to become reality. (Senate runoff race in January 2021)
If the latter scenario should come to pass, the market will probably throw a tantrum once again, as it shrugs off the understanding that earnings are trending higher. Tantrums, therefore and as the latest tantrum proved, are likely limited for duration and downward price action. Cooler heads would prevail under a Blue Wave scenario and investors would revert to recognizing the longer-term earnings projection/forecast. In this context and should this Blue Wave scenario play out (Senate run-off races won't be known until January 2021), investors would prove wise for buying into the downside market pressure.
The market can choose whether to focus on the positives or the negatives of whatever outcome we eventually get and of course, the Fed will likely remain accommodative either way. That means the best course is to stay with the strategy that has worked since the COVID selloff. That is similar to how I approached this election as well. As the market dipped in mid-late October, I bought the dip and positioned for what I believed to be an eventual rally post the election.
The rally was more robust than I anticipated, but the outcome was planned for as part of a disciplined approach to engaging downward market pressure. So let's take a look at the up-to-date S&P 500 technical overview.
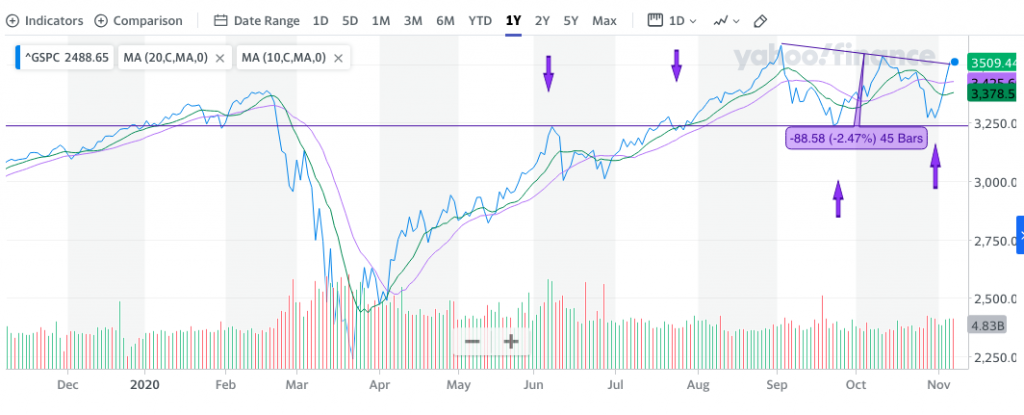
What we can identify from the technical representations above is the following key points:
- The S&P 500 had an extremely swift upside move.
- The S&P 500 did not make a series of lower lows.
- Support held at the former base of the head-n-shoulders pattern (3,230-3,240).
- Closed the week above the 10 and 20-DMA, with the 20-DMA crossing above the 10-DMA and indicating a rapid and broad market advance.
- Closed the week slightly above the downward sloping trend line.
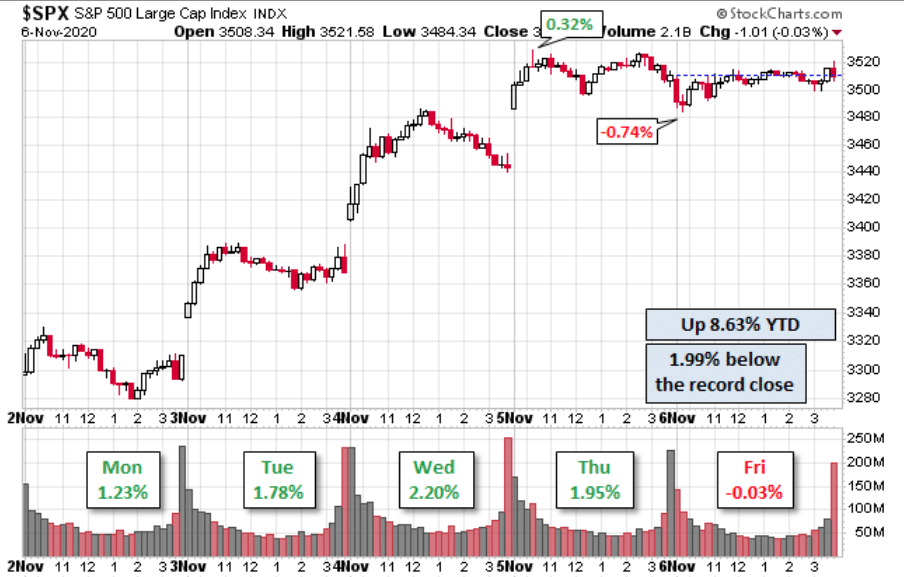
With this past week's price action, the S&P 500 is up 7.32% so far in November. This is the best start (after 4 days) to the month of November ever. 2020 continues to provide investors with records and unprecedented occurrences. SO REMAIN FLEXIBLE FOLKS!!
In addition to the strength of equities this past week, bonds witnessed a goodly amount of selling pressure. The 10-year yield rose to over .94% this past week at one point.
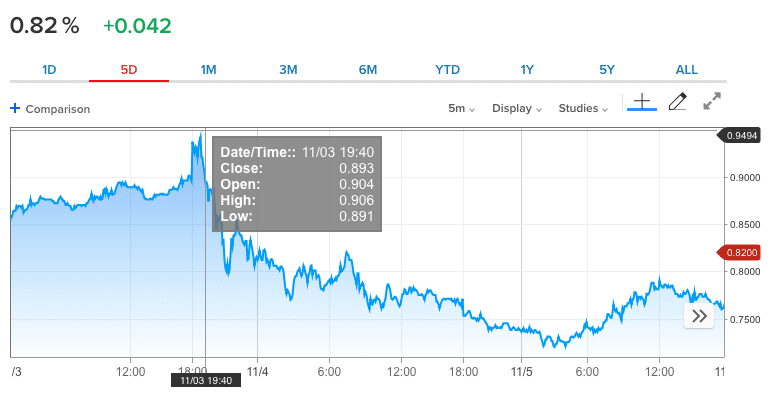
Just as it was with the weekly sector performance, one of the ways in which we validate market advances is by looking at where strength and weakness may be found. In the case of asset classes, when we see bonds/Treasuries selloff while stocks are advancing, it lends validation to the equity market advance/price action. (See chart below SPY:TLT ratio Chris Ciovacco)
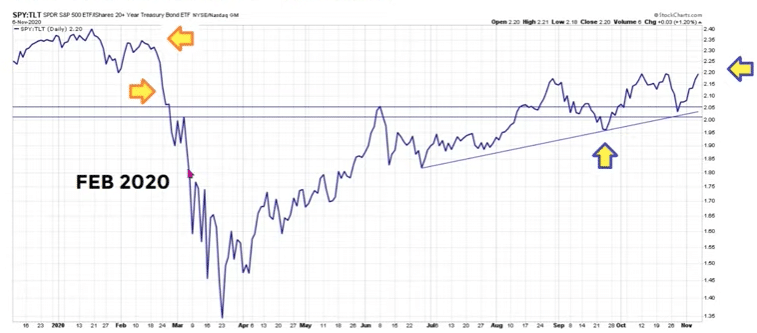
The chart above depicts the ratio or relative performance of stocks:bonds through the S&P 500 index ETF (SPY) and bond ETF (TLT). In the previous week, stocks were weaker than bonds and narrowly missed touching an upward sloping trend line of support. This past week, however, stocks outperformed bonds mightily and are now on the verge of making new relative performance highs for the post-pandemic period.
Thus far, we like what took place in the way of risk-on appetite and the technical performance of the S&P 500 this past week. Underneath the hood of the S&P 500, we also find strength in the market internals/breadth indicators. Recall, however, that in the prior week breadth appeared on the verge of an ominous bearish breadth thrust. The following was from my previous weekly Research Report:
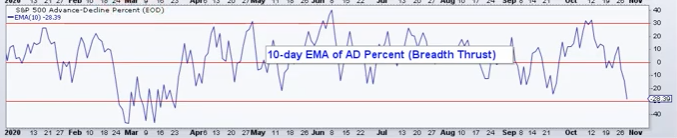
"We separated the bottom chart from the former chart cluster. This S&P 500 chart recognizes the 10-Day EMA of A/D Percent, otherwise known as a breadth thrust of the 10-DAY A/D%. As one can see off to the left side of the chart, it is coming dangerously close to firing a bearish breadth thrust with a break below that -30% level and as it did back in March (Arthur Hill). If there was a time to watch/pause/hunker down/hedge if inclined/manage risk if deemed necessary, this may prove that time to do so."
All manners of technical/breadth analysis on the market are recognized through the context of WHAT HAS HAPPENED and IS DEVELOPING! The developing situation does not predict outcomes but does point toward probabilities. While breadth was on the verge of producing a bearish breadth thrust, it has found an interim washout level and subsequent price reversal for the S&P 500, Nasdaq, NYSE, Dow and Russell 2000. That's just how quickly things can change and why we can take a cautious approach, but without going to an "all cash" position.
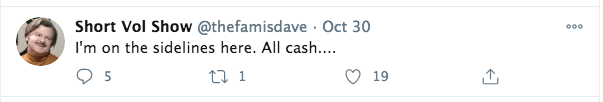
For those who took an "all cash" position at the end of October, they were kicking themselves through the first week of November because they likely reacted to poor price action without a more confident and longer-term game plan. Now things have changed, shifted from a bearish developing situation to a more bullish developing situation.
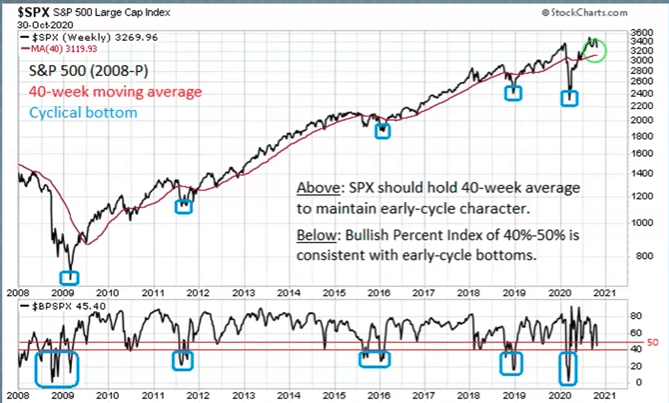
The chart above is a longer-term chart of the S&P 500 and its Bullish Percent Index in the bottom panel. What happened in 2020 was historic in that the Bullish Percent Index hit extreme washout levels, indicating there was a good probability for the market to have been massively deleveraged/sold and henceforth to be bought rather quickly. We've seen the BPI drop with the overall market 4 separate times over the course of the market recovery cycle. (Chart below)
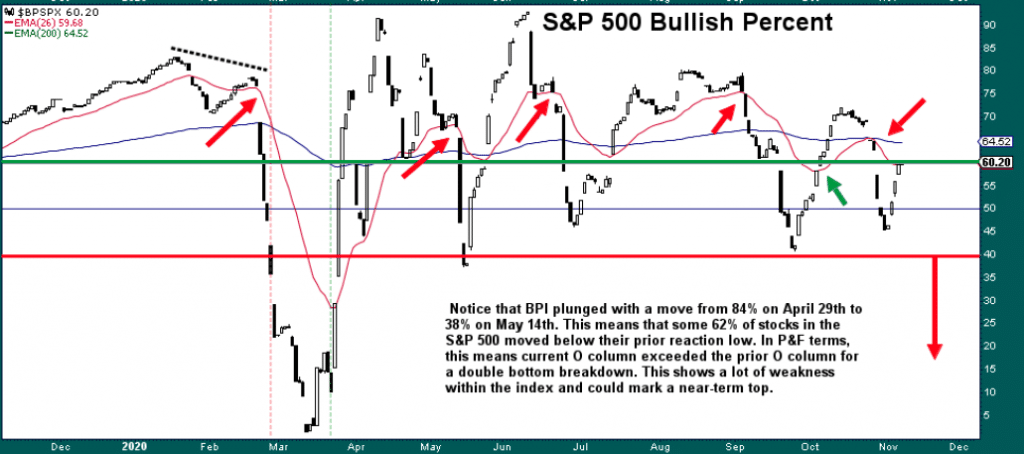
The largest drop in this breadth indicator since the March lows came in mid-May. Since that time, and for each of the large BPI drops, the BPI has not made a lower low. The most recent drop found the BPI bottoming on October 30th at roughly 47%, higher than the September 2020 dip. At present, the S&P 500 Bullish Percent Index is at 60, the sell signal Moving Average is just below it as of Friday's close. Keep in mind that the term "sell signal" is simply a directional-bias indication and not necessarily a call to take action.
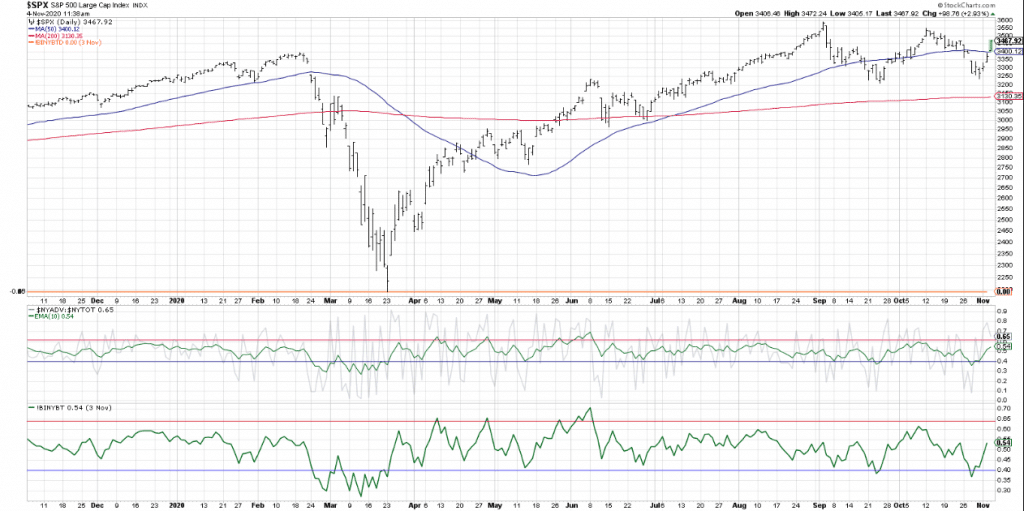
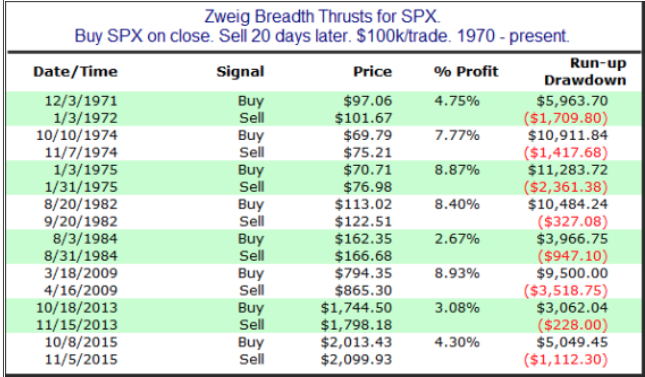
As noted previously, the S&P 500 20-DMA crossed over its 10-DMA, indicating there has been a broad market advance, not just a handful of stocks rising. Indeed, this week the market showed the opposite of the prior weakness in breadth indicators. In fact, the strength in breadth alerted us to the probability of a Zweig Breadth Thrust firing. How do we define a Zweig Breadth Thrust? First the chart...
Technicians have a lot of versions of a “breadth thrust” signal, and the basic idea is that the Advance-Decline numbers suddenly go from not so good to REALLY good in a short amount of time. The late Martin Zweig was one of the first to examine this phenomenon, and he came up with specific criteria for what is now known by technicians as a Zweig Breadth Thrust (ZBT) signal.
Zweig quantified this idea by first calculating a ratio of the number of advances divided by the sum of advances plus declines. In other words, A/(A+D). Then he calculated a 10-day EMA of that ratio, which we would call an 18% Trend according to our preference for the originalist terminology. To get a Zweig Breadth Thrust signal, that ratio needed to go from below 0.40 to above 0.615 in 10 trading days or less. The idea is that when there is such a signal, it is a sign that a rapid surge of money is trying to push its way through the door to get into the market, and that is a sign of continuing liquidity to fuel an uptrend.
Moreover, maybe it is no coincidence that a Zweig Breadth Thrust is near occurring after the election. No matter the election outcome, upturns in money flows to the stock market have come with elections, historically.
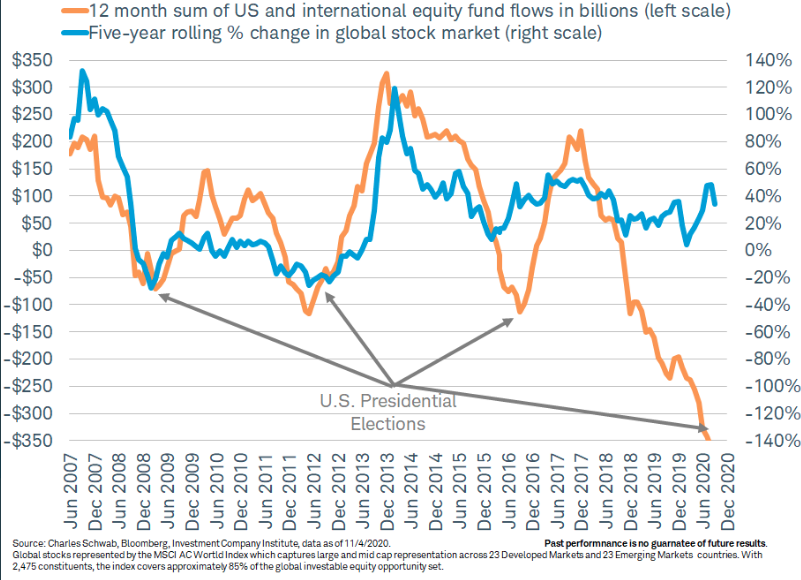
The chart doesn't lie, for each of the last several election cycles, we've seen inflows of capital for equities. Let's not forget about the vaccine. The market may be beginning to anticipate the *tsunami* of Phase III read outs for vaccines and therapeutics that we are going to see over the next 6 weeks. Many of these are likely to be positive developments.
In my final segment of this week's Research Report, I'll pick up more on our Zweig Breadth Thrust analysis, but for now, let's further explore some positive, yet under the radar indicators of overall market strength. In this week's State of the Market report at Finom Group, I identified new post-pandemic highs in several areas of the market as follows:
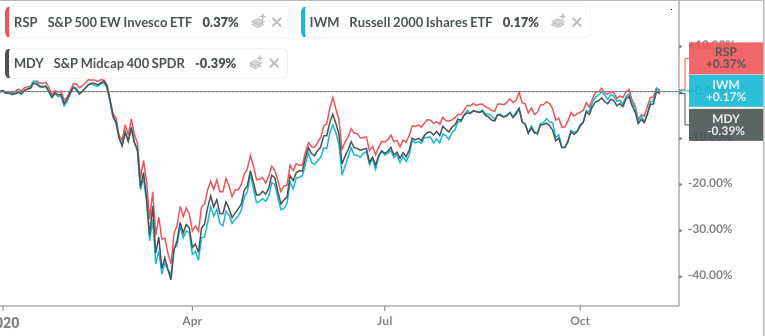
- S&P 500 equal-weight (RSP), Russell 2000 (IWM) and S&P 400 (MDY) are at their highest levels since February, and they are back in positive territory for the year.
- This is another way of suggesting there has been broad-based industry and overall market strength during the recovery period and which took place this past trading week.
While we can look at the percentage of stocks trading above their 50-DMA and 200-DMA to our heart's content and find them having surged this past week, in the context of a breadth thrust we would better look at the faster moving average. From this perspective we look at the percentage of stocks trading above their 10-DMA.
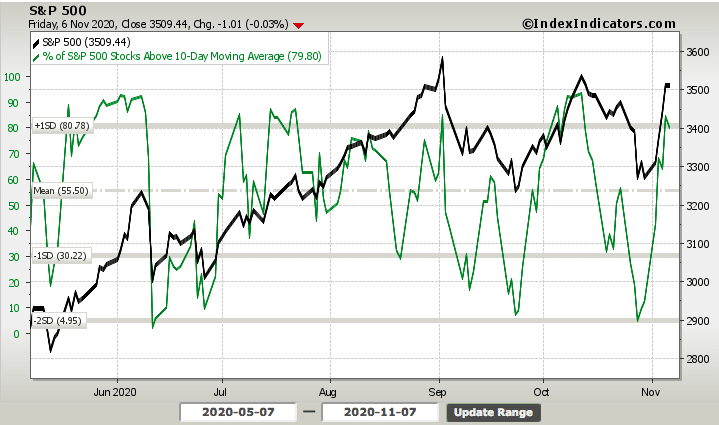
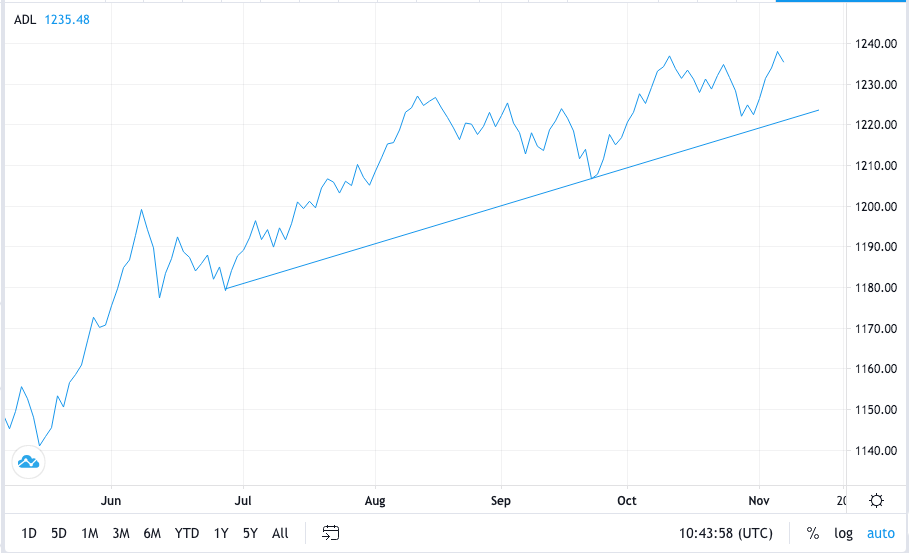
Not only did the breadth indicator recently test a significant washout level at 5%, but it rallied to above 80% in one trading week, in keeping with our Zweig Breadth Thrust potential. As it pertains to the Advance/Decline line for the NYSE (chart below), we can see that this is near its former highs. Breadth "tends" to lead price, especially when in an uptrend. Macro-events and or exogenous events can offset breadth signals of course.
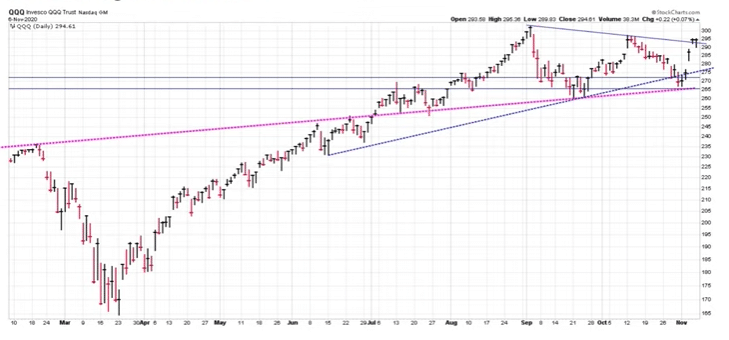
While the S&P 500 showed signs of broadening strength this past week, the Nasdaq proved that much more technically aggressive or positive. As shown in the chart below, the Nasdaq 100 (QQQ) finished both Thursday and Friday above a downward trend line. The tech-heavy Nasdaq, if proven to carry this strength into the coming week, may be able to pull the whole of the Information Technology and Communication Services sectors of the S&P 500 with it and the index to new highs.
If we refrain from all of the “what if'' scenarios, and there are a litany of those out there, we'll likely make better long-term investing decisions. This past week has taught some investors another valuable lesson, which seems a running theme in 2020. Yet you can bet the next time investors face a complicated situation they will once again march to a beat that usually leads the army following the “geniuses” off of a cliff. Stay true to the course of the long-term trend of the equity market, which marches upward.
"Emotion is the one component that cannot be included in an investment strategy. If price action to the downside brings out the worst of your emotions, there are simple solutions for that: Look away and know that it is temporary, not permanent!"
~Golden Nugget
It's The Economy, "Ya Cheeky Bastage"
With the focus of the world, let alone American's and the investor community still focused on an inevitable Presidential election outcome/victor, the economic recovery continues to unfold. The relative, surprising strength of the recovery cycle has proven problematic for the negotiating and delivery of another fiscal relief package, but to-date the market simply hasn't been put in a position to demand a relief package. At best, the market has simply demanded "ongoing negotiations". The market is relying on the economic data to determine its level of complacency and/or temperament. Speaking of the economy and economic data...
As a more prolific portion of the U.S. economy has been forcibly reduced due to the pandemic, service sector, the manufacturing sector has performed quite well over the last 6 months. On Monday, the latest ISM manufacturing index proved the ongoing strength in the manufacturing sector.
The Institute for Supply Management said its index of manufacturers climbed to a two-year high of 59.3% last month from 55.4% in September. Manufacturers have expanded for six months in a row. The increase last month topped the 56.5% estimate of economists polled by MarketWatch.
Manufacturing at a Glance
October 2020
| Index | Series Index Oct | Series Index Sep | Percentage Point Change | Direction | Rate of Change | Trend* (Months) |
|---|---|---|---|---|---|---|
| Manufacturing PMI® | 59.3 | 55.4 | +3.9 | Growing | Faster | 5 |
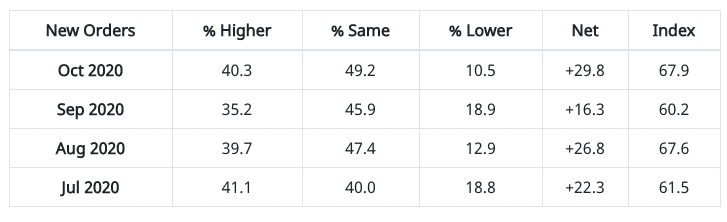
| New Orders | 67.9 | 60.2 | +7.7 | Growing | Faster | 5 |
| Production | 63.0 | 61.0 | +2.0 | Growing | Faster | 5 |
| Employment | 53.2 | 49.6 | +3.6 | Growing | From Contracting | 1 |
| Supplier Deliveries | 60.5 | 59.0 | +1.5 | Slowing | Faster | 12 |
| Inventories | 51.9 | 47.1 | +4.8 | Growing | From Contracting | 1 |
| Customers’ Inventories | 36.7 | 37.9 | -1.2 | Too Low | Faster | 49 |
| Prices | 65.5 | 62.8 | +2.7 | Increasing | Faster | 5 |
| Backlog of Orders | 55.7 | 55.2 | +0.5 | Growing | Faster | 4 |
| New Export Orders | 55.7 | 54.3 | +1.4 | Growing | Faster | 4 |
| Imports | 58.1 | 54.0 | +4.1 | Growing | Faster | 4 |
| OVERALL ECONOMY | Growing | Faster | 6 | |||
| Manufacturing Sector | Growing | Faster | 5 |
The gauge for new orders jumped to 67.9% from 60.2%, the highest reading since 2004. The index for production also increased to 63% from 61 percent.
In another good sign, employment turned positive for the first time in 14 months. The index rose 3.6 points to 53.2 percent. While the manufacturing sector is holding up very well, as goods are found with more favor than services during the post-lockdown phase of the economic recovery cycle, future economic restrictions such as those imposed in Europe may need to be part of one's economic outlook and with respect to the epidemic infection and hospitalization rate in the United States.
Ahead of the service sector data this past week, auto sales forecast was offered. The BEA released their estimate of light vehicle sales for October this morning. The BEA estimates sales of 16.21 million SAAR in October 2020 (Seasonally Adjusted Annual Rate), down 0.5% from the September sales rate, and down 3.3% from October 2019. This was below the consensus estimate of 16.5 million SAAR.
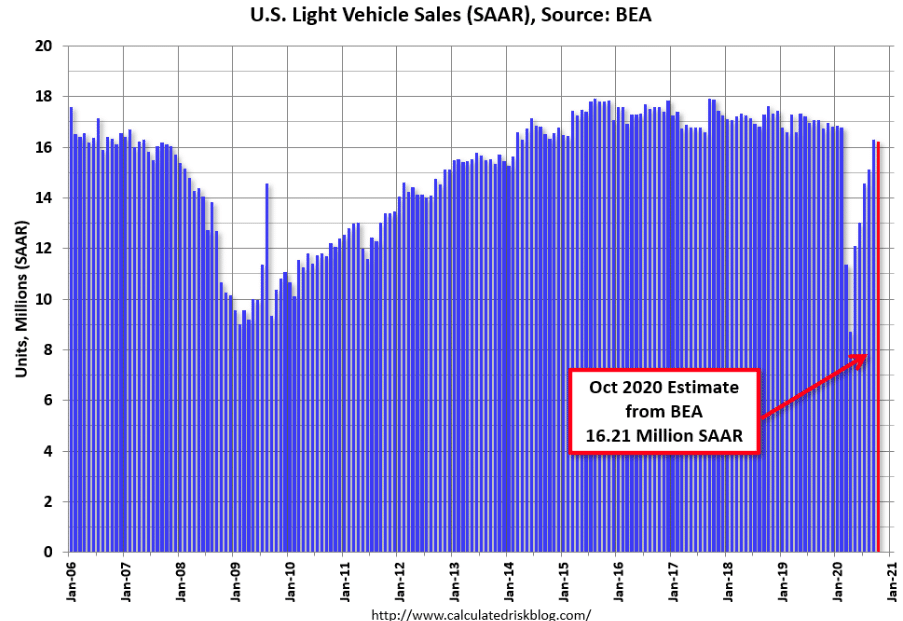
Since April, sales have increased, but are still down 3.3% from last year. The second graph shows light vehicle sales since the BEA started keeping data in 1967. Sales-to-date are down 17.3% in 2020 compared to the same period in 2019.
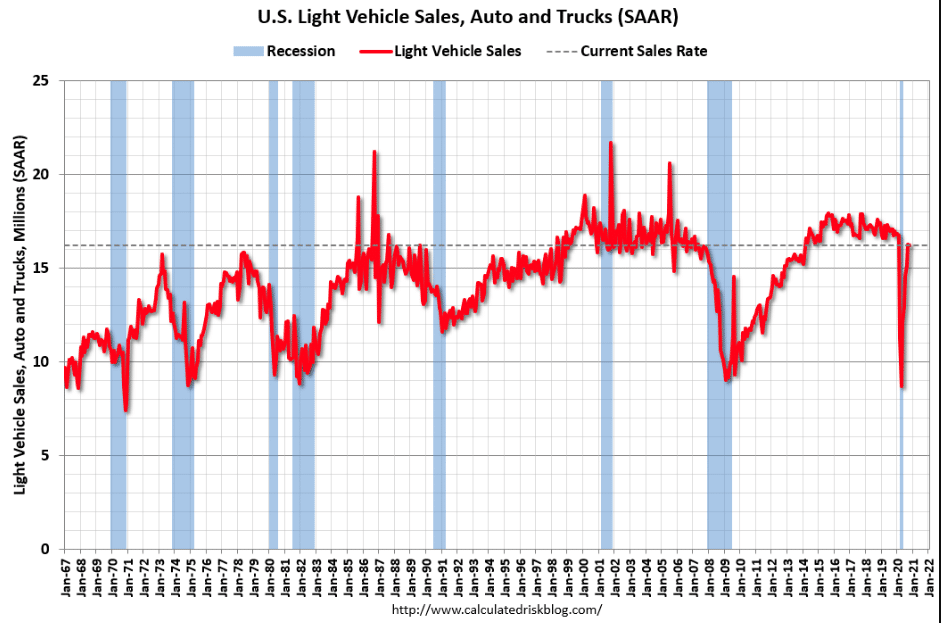
In 2019, there were 14.48 million light vehicle sales through October. In 2020, there have been 11.97 million sales. And now for the ISM service sector results, which did prove to disappoint.
Economic activity in the services sector grew in October for the fifth month in a row, say the nation's purchasing and supply executives in the latest Services ISM Report On Business. The Services PMI™ registered 56.6 percent, 1.2 percentage points lower than the September reading of 57.8 percent.
ISM SERVICES SURVEY RESULTS AT A GLANCE COMPARISON OF ISM SERVICES AND ISM MANUFACTURING SURVEYS*
October 2020
| Services PMI™ | Manufacturing PMI® | ||||||||
|---|---|---|---|---|---|---|---|---|---|
| Index | Series Index Oct | Series Index Sep | Percent Point Change | Direction | Rate of Change | Trend** (Months) | Series Index Oct | Series Index Sep | Percent Point Change |
| Services PMI™ | 56.6 | 57.8 | -1.2 | Growing | Slower | 5 | 59.3 | 55.4 | +3.9 |
| Business Activity/ Production | 61.2 | 63.0 | -1.8 | Growing | Slower | 5 | 63.0 | 61.0 | +2.0 |
| New Orders | 58.8 | 61.5 | -2.7 | Growing | Slower | 5 | 67.9 | 60.2 | +7.7 |
| Employment | 50.1 | 51.8 | -1.7 | Growing | Slower | 2 | 53.2 | 49.6 | +3.6 |
| Supplier Deliveries | 56.2 | 54.9 | +1.3 | Slowing | Faster | 17 | 60.5 | 59.0 | +1.5 |
| Inventories | 53.1 | 48.8 | +4.3 | Growing | From Contracting | 1 | 51.9 | 47.1 | +4.8 |
| Prices | 63.9 | 59.0 | +4.9 | Increasing | Faster | 7 | 65.5 | 62.8 | +2.7 |
| Backlog of Orders | 54.4 | 50.1 | +4.3 | Growing | Faster | 5 | 55.7 | 55.2 | +0.5 |
| New Export Orders | 53.7 | 52.6 | +1.1 | Growing | Faster | 3 | 55.7 | 54.3 | +1.4 |
| Imports | 52.5 | 46.6 | +5.9 | Growing | From Contracting | 1 | 58.1 | 54.0 | +4.1 |
| Inventory Sentiment | 51.1 | 55.4 | -4.3 | Too High | Slower | 3 | N/A | N/A | N/A |
| Customers' Inventories | N/A | N/A | N/A | N/A | N/A | N/A | 36.7 | 37.9 | -1.2 |
| Overall Economy | Growing | Slower | 5 | ||||||
| Services Sector | Growing | Slower | 5 |
WHAT RESPONDENTS ARE SAYING
- “Business has improved, but greatly reliant on COVID-19-related restrictions. Supplier’s inventories and lead times are longer and spotty with outages due to keeping lead times lean as a cash flow measure, but putting consistent supply at risk.” (Accommodation & Food Services)
- “Interesting business cycle: Labor is still in short supply, and work orders are picking up.” (Construction)
- “Challenges to maintain safety and prevent the spread of COVID-19 has meant changes in the way activities are carried out. Purchases of personal protective equipment [PPE] and facilities equipment along with modifications to buildings and walkways has led to higher spending in some areas.” (Educational Services)
- “Given COVID-19, the adjustments we have made across the company has allowed us to reach previous employment levels, and those furloughed are back to work. Everyone is careful to wear the required PPE and keep distancing. We have added additional cleaning staff between shifts to upgrade sanitation.” (Finance & Insurance)
- “The new normal COVID-19 environment is causing uncertainty, but we’ve seen an increase in business that is close to pre-COVID-19 volumes for procedures.” (Health Care & Social Assistance)
- “While the economy is getting better, there is still very much uncertainty about the future. We are putting capital expenditures on hold until we gain additional confidence and certainty.” (Information)
- “We are remaining cautiously positive and resuming normal business operations.” (Management of Companies & Support Services)
- “Encouraging signs continue for an improved fourth quarter.” (Professional, Scientific & Technical Services)
- “We continue to be cautiously optimistic that the rebound in business that began in July continues to sustain.” (Retail Trade)
- “Business continues to gain as people are traveling and businesses are opening up to consumers.” (Wholesale Trade)
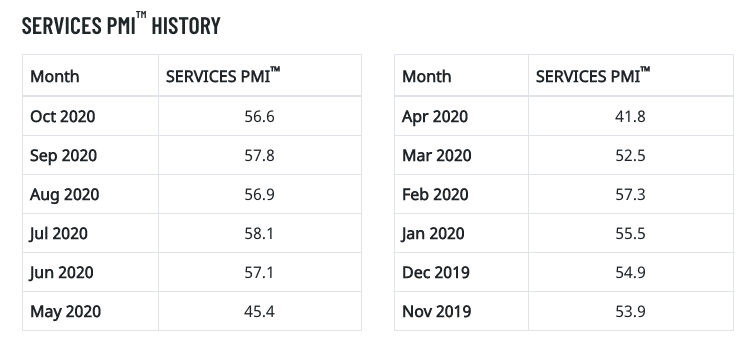
The table of the Services PMI history above helps to put into perspective the MoM decline, which still proves very strong on a YoY and trend-basis. Given that Massachusetts and certain cities in Texas have re-employed economic restrictions aimed at the service sector, we may see further weakening of the service sector through the end of the year. Remember that dining out may come under pressure as the COVID infection rate rises into the winter, for which patrons may avoid restaurants and bars.
Some of the most relevant of the restaurant industry data has come from Open Table, during the post-pandemic recovery phase of the economic cycle. The data can be tracked from a regional and chronological basis.
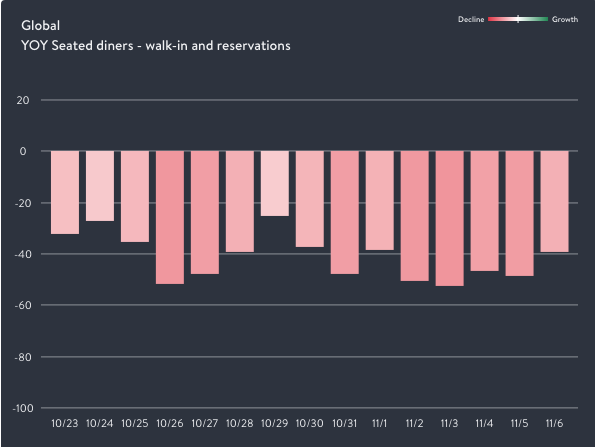
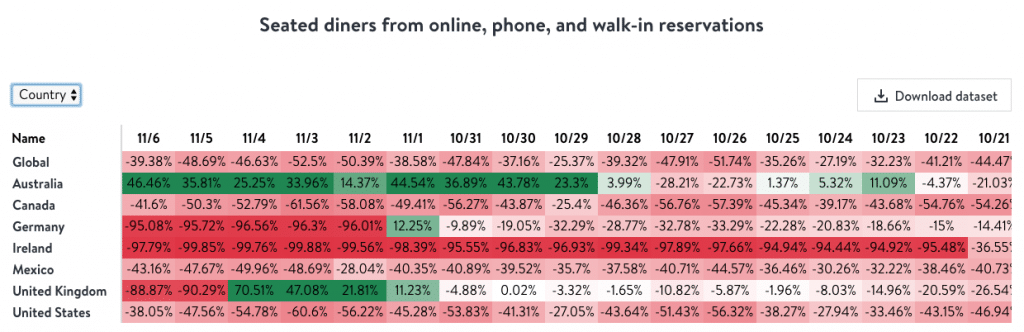
Based on the current Open Table industry data, it would appear as though the U.S. national seated dining reservations have been improving in recent days. Having said that, we can also see how choppy the data has been since late October and still with YoY declines since dining-in had been reinstated nationally, in June 2020.
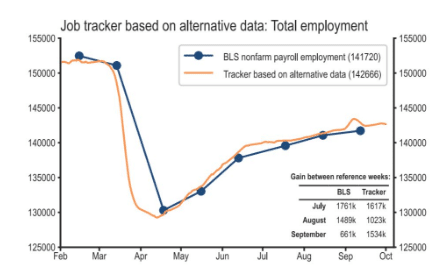
The labor and employment aspects of the economic recovery were also in full view of investors this past week as the first of 3 key reports were issued for the month of October. The ADP October estimate of 365K Nonfarm private employment jobs gained was a decrease over the ADP revised September figure of 749K. Here is a visualization of the 2 series over the previous 12 months.
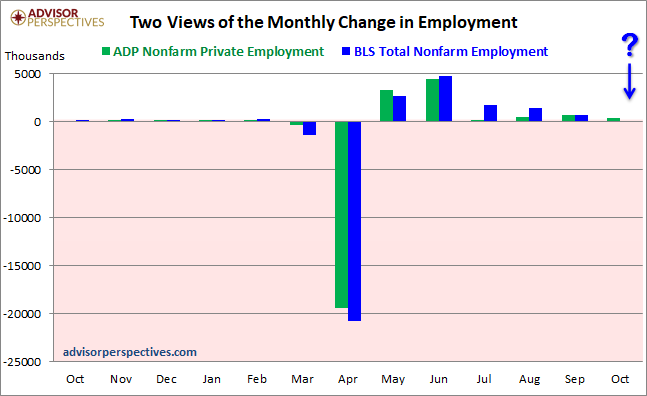
The 365K estimate came in below the consensus of 650K for the ADP number. It's clear that the ADP payroll growth has been decelerating, but that has not proven to offset the fact that job growth is above that of the typical expansion cycle.
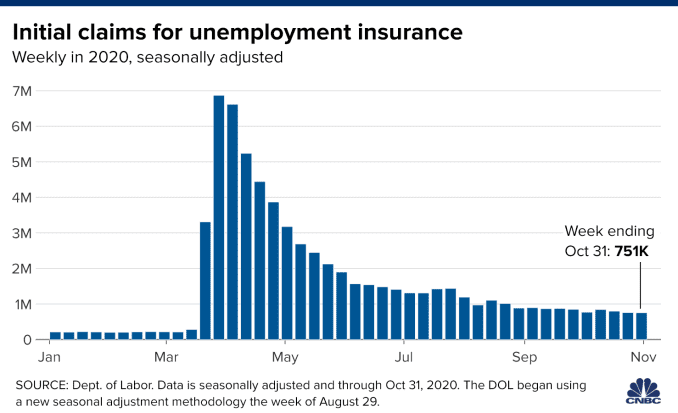
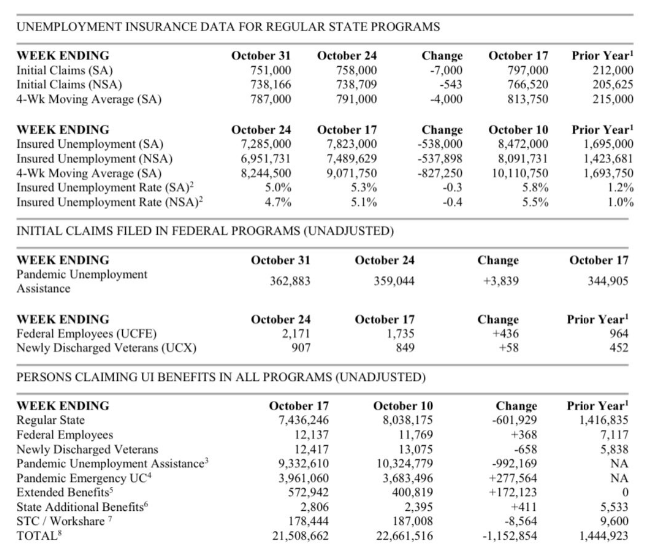
The faster moving employment data is released every Thursday morning, depicting weekly jobless claims. The Labor Department reported Thursday that 751,000 U.S. workers filed for benefits, compared with 758,000 the previous week. Economists surveyed by Dow Jones had been expecting 741,000. This was the third straight week that claims were below 800,000, and the four-week moving average fell to 787,000.
Continuing claims fell for the sixth straight week, this time by 538,000 to nearly 7.3 million. However, part of the reason was the continued migration from those losing benefits into the Pandemic Emergency Unemployment Assistance program, which saw its rolls increase by 277,564 to 3.96 million. Continuing claims are delayed by a week.
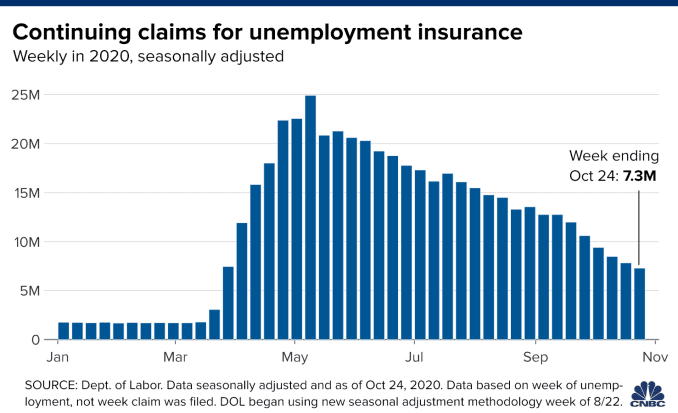
At the same time, the total for those receiving benefits showed a sharp decline, falling by 1.15 million to 21.5 million. For the same period in 2019, 1.44 million people were getting benefits, reflecting just how deep the jobless problem remains in the pandemic era.
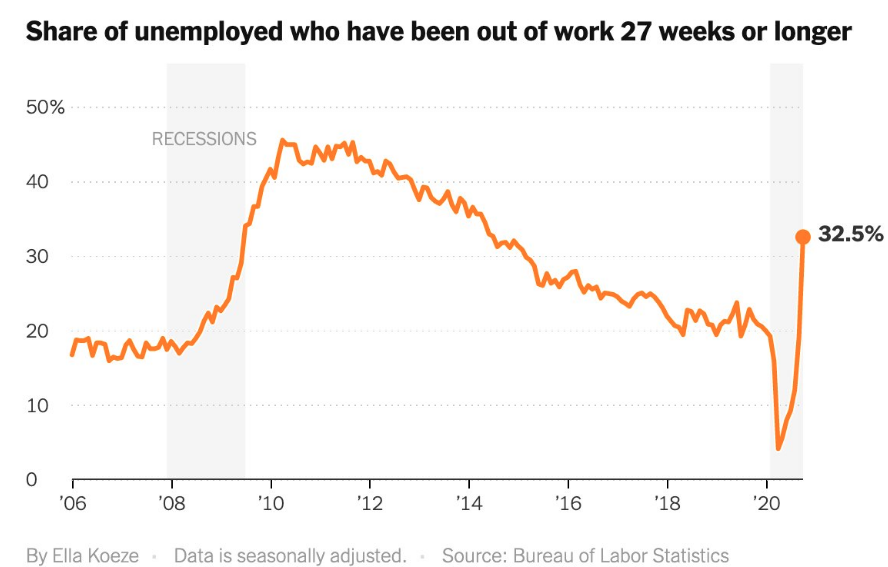
The good news remains, jobless claims continue to trend lower, however slowly. The bad news is that we gained jobs this month, but the chart shows worrying evidence of more people falling into long term and permanent job loss/unemployment.
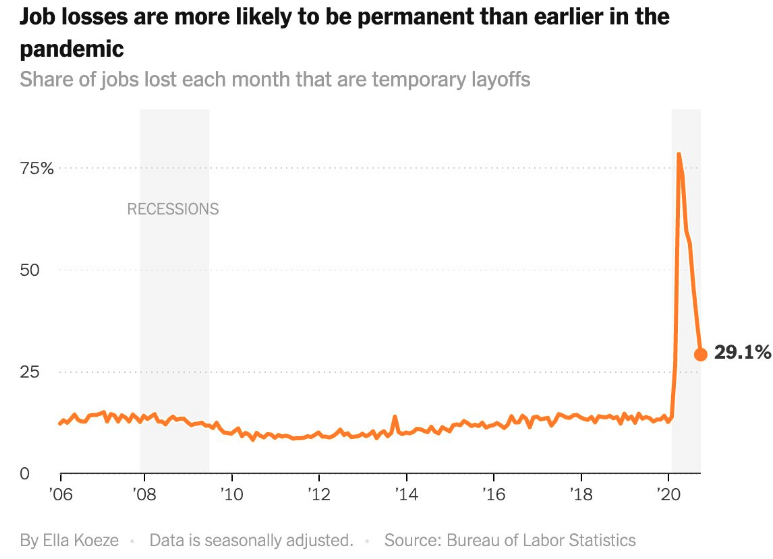
What the chart above depicts or assumes is that as the share of jobs lost each month graph is declining to represent temporary layoffs declining, permanent jobs lost is increasing. This does seemingly fit with the chart analysis of permanent job loss below:
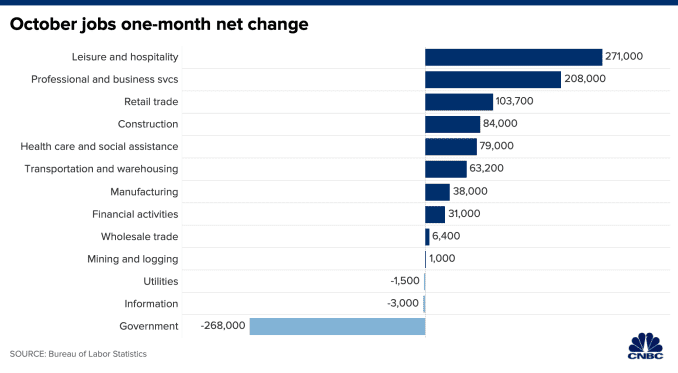
Last, but certainly not least was the release of the monthly Nonfarm Payroll report via the Bureau of Labor Statistics. The economy added 638,000 Nonfarm payrolls and the unemployment rate fell by a full percentage point to 6.9%. The government compiled the data for the report in the middle of October. The report did include the loss of 268,000 government jobs, with 147,000 of those Census workers and many others in education.
Economists’ expectations for October employment were wide-ranging with some closer to 200,000 and others at 800,000. But they mostly agree the momentum looks set to slow, and the typical hiring that goes on in November and December for holiday shopping, travel and other activities will be much smaller this year.
Since we're on the theme related to the service sector, the leisure and hospitality industry continued its rebound after the coronavirus and efforts to contain its spread walloped spending at restaurants, hotels and bars earlier in the year. The sector, which added 271,000 jobs last month, saw about 80% of that growth from restaurants and bars that rehired workers even as the U.S. set records for new daily Covid-19 infections.

Despite the labor market’s stronger October, employment was below its February level by 10.1 million, or 6.6 percent. The labor and employment data continues to improve at a slower pace and may simply be normalizing with respect to an infancy stage of the economic recovery and the fact that not all aspects of the economy have reopened fully.
Some of the high frequency data we have been tracking remains steady and with fits and starts here and there. The TSA is providing daily travel numbers.
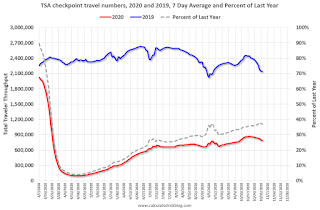
This data shows the seven day average of daily total traveler throughput from the TSA for 2019 (Blue) and 2020 (Red). The dashed line is the percent of last year for the seven day average. This data is as of Nov 1st. The seven day average is down 63% from last year (37% of last year). There has been a slow increase from the bottom.
From HotelNewsNow.com: STR: US hotel results for week ending 31 October
U.S. weekly hotel occupancy was the lowest for any week since late June, according to the latest data from STR through 31 October.
25-31 October 2020 (percentage change from comparable week in 2019):
• Occupancy: 44.4% (-29.0%)
• Average daily rate (ADR): US$91.56 (-27.4%)
• Revenue per available room (RevPAR): US$40.70 (-48.4%)With rising COVID-19 case numbers and less leisure travel, the U.S. saw a second consecutive week with fewer hotel guests. During October 25-31, room demand fell 1.3 million from the prior week, leading to the country’s lowest occupancy level (44.4%) since the week of June 14-20.
emphasis added
Since there is a seasonal pattern to the occupancy rate - see graph below - we can track the year-over-year change in occupancy to look for any improvement. This table shows the year-over-year change since the week ending Sept 19, 2020:
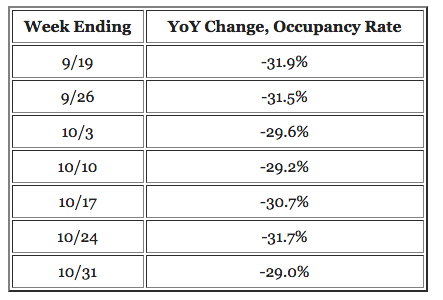
This suggests little improvement over the last 7 weeks, but not as bad as "lowest since June" would suggest. Some of the recent decline in the occupancy rate is just seasonal.
The following graph shows the seasonal pattern for the hotel occupancy rate using the four week average.
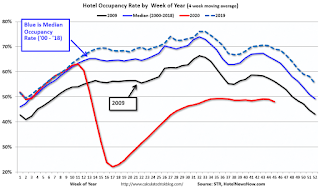
The red line is for 2020, dash light blue is 2019, blue is the median, and black is for 2009 (the worst year since the Great Depression for hotels - before 2020). Seasonally we'd expect the occupancy rate to decline into the new year. Note that there was little pickup in business travel that usually happens in the Fall. Note: Y-axis doesn't start at zero to better show the seasonal change.
We continue to see the consumer hold up well in the current economic environment, which remains with a higher Personal Savings Rate, partly fueled by transfer payments from the former Cares Act.
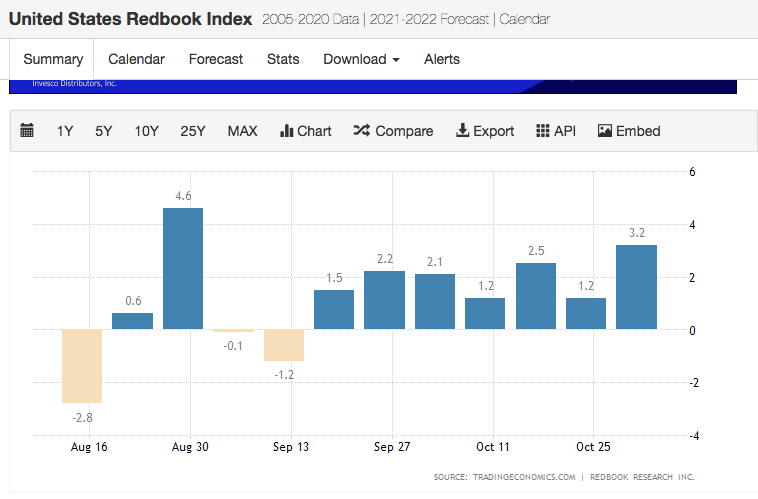
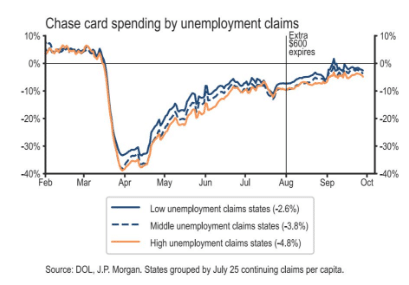
Nonetheless, we have seen Redbook weekly retail sales trend higher for 7 consecutive weeks. Furthermore, when we look at Credit/Debit card spending data from J.P. Morgan Chase and juxtapose it with the employment data... More jobs equal more paychecks equal more spending in the United States; always has and likely always will. (See charts below)
With consideration to some of the high frequency or "alternative data" and more broadly, high-frequency data show that economic activity in advanced economies weakened in October amid renewed outbreaks of the coronavirus, and the latest readings suggest the downtrend continued at the beginning of November, particularly in major European countries.
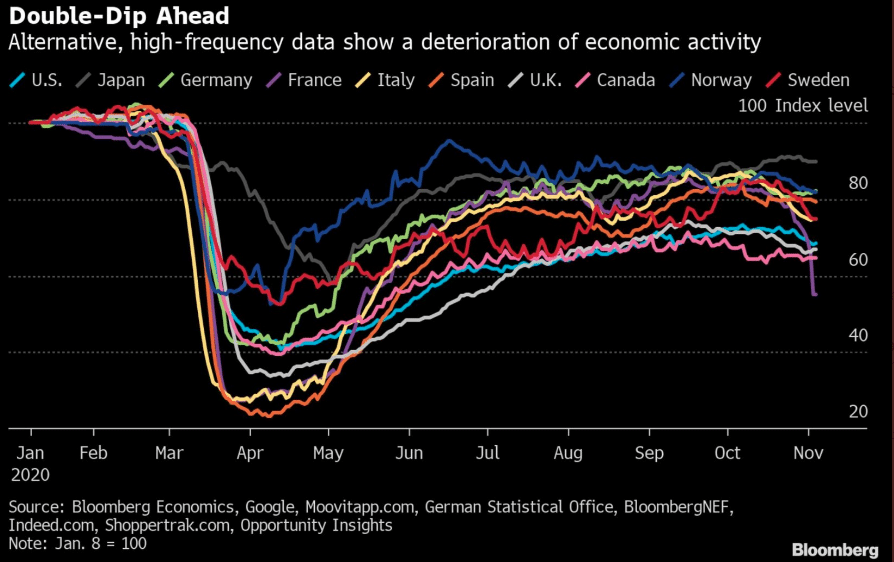
Activity in France and Italy turned down sharply as lockdown restrictions took effect, according to Bloomberg Economics gauges that integrate data such as mobility, energy consumption and public transport usage. Activity in the U.S., U.K. and Canada also declined.
The upcoming week will prove a light economic data docket, with no economic data releases slated for Monday or Wednesday. Economists and market participants will continue to monitor the labor markets in the coming week with Job Opening & Labor Turnover Survey (JOLTS) released on Tuesday and jobless claims on Thursday.
I remain of the opinion that the economic data collectively points to a normalization of economic expansion, but one that is dependent upon the shape of the epidemic curve i.e. COVID-19 infection rate. As the infection rates rise, hospitalization rates follow and economic activity regresses, to some degree, where the aforementioned occurs.
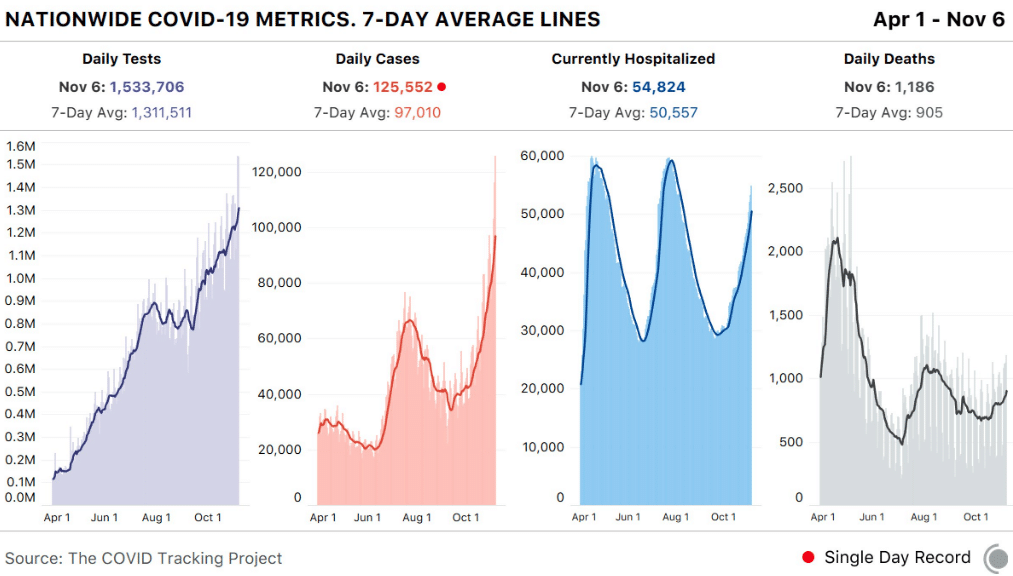
While deaths lag both cases and hospitalizations, we are already seeing a trend higher at over 939 deaths per day in the last week (up from 667/day in early October). Will the new high in cases lead to a new high in daily deaths? This is unlikely at current case levels for a few reasons:
- Hitting a new case high do not mean that the virus itself is as prevalent across the US as it was in March and April.
- Testing in the US is up 13x from the levels at the end of March and 8x from the April peak in cases.
- If we attempt to adjust the prior cases for lower testing, this is what the chart looks like…

What you see is that the current state of the outbreak is now at its highest level since late April, but still well below the prior peak. Also important, the new cases today are showing a shift to a younger population and from the increased testing we are picking up many more cases with milder symptoms that have a lower probability of death. All cases are not equivalent.

There has not been the same appetite for imposing economic restrictions as there was from March-May 2020. The fact that a vaccine is likely to be approved around the end of November, if not very early December, calls for careful decisions on the parts of local governments to either stay the course or take action against the rising infection rate. Given the timing of the spike in infections fell within the election period, governments have pushed forward the voting process in favor of tackling issues surrounding the rising infection and hospitalization rates. This lack of focus may prove to wear thin coming out of the election period and find governments once again making tough choices, as they did in Massachusetts and parts of Texas recently.
From the perspective of an investor, I'm of the opinion that should regional economic restrictions be found making headlines again, they will prove a temporary hit to markets, and longer-term opportunity for investors who buy into market weakness.
Earnings & Valuations Don't Prove Scary
While the market has not been able to achieve new highs since September 2nd, the earnings trajectory has, like the economy, continued to recover. Recall from last week, FactSet EPS tracking for the Q3 2020 earnings period:
"This is, once again, a significant upward revision that takes the tracking of Q3 2020 EPS from -16.5% to down just -9.8 percent. Yes, this recent revision blows my previous -15% decline model/forecast out of the water, I am happy to say!"
Fast-forward to this past trading week, as of November 6th, and the positive EPS revisions continue on a weekly basis. Below is the updated, positive FactSet tracking for the stated period:
- As of today, the S&P 500 is reporting a year-over-year decline in earnings of -7.5%, compared to a YoY decline in earnings of -9.9% last week and a YoY decline in earnings of -21.2% at the end of the third quarter.
- Positive earnings surprises reported by companies in multiple sectors (led by the Health Care and Consumer Discretionary sectors) were responsible for the decrease in the overall earnings decline during the past week.
Insight/2020/11.2020/11.06.2020_EI/S%26P%20500%20Earnings%20Growth%20Q3%202020.png?width=920&name=S%26P%20500%20Earnings%20Growth%20Q3%202020.png)
- In terms of revenues, 79% of S&P 500 companies have reported actual revenues above estimates, which is above the 5-year average of 61%. If 79% is the final percentage for the quarter, it will mark the highest percentage of S&P 500 companies reporting a positive revenue surprise since FactSet began tracking this metric in 2008. The current record is 78%, which occurred in Q4 2017.
- In aggregate, companies are reporting revenues that are 2.6% above the estimates, which is also above the 5-year average of 0.7%. If 2.6% is the final percentage for the quarter, it will mark the largest revenue surprise percentage reported by the index since FactSet began tracking this metric in 2008. The current record is 2.2%, which occurred in Q4 2012.
Insight/2020/11.2020/11.06.2020_EI/S%26P%20500%20Revenues%20Above%20In%20Line%20Below%20Estimates%20Q3%202020.png?width=920&name=S%26P%20500%20Revenues%20Above%20In%20Line%20Below%20Estimates%20Q3%202020.png)
Looking at future quarters, analysts predict a (year-over-year) decline in earnings:
- 4th quarter (-10.9%) of 2020.
- However, they are also project a return to earnings growth starting in Q1 2021 (14.5%).
- The forward 12-month P/E ratio is 21.6, which is above the five-year average and above the 10-year average.
- During the upcoming week, 15 S&P 500 companies (including three Dow 30 components) are scheduled to report results for the third quarter.
As the earnings' beat rate continues its torrid pace and the positive quarterly revisions march on, it should be perfectly acceptable to witness stock prices declining while earnings move higher as it declares a longer-term and more profitable opportunity for savvy investors. The current consensus analysts estimates for 2020 EPS and 2021 continue to ratchet higher and to their highest forecast since the recession.
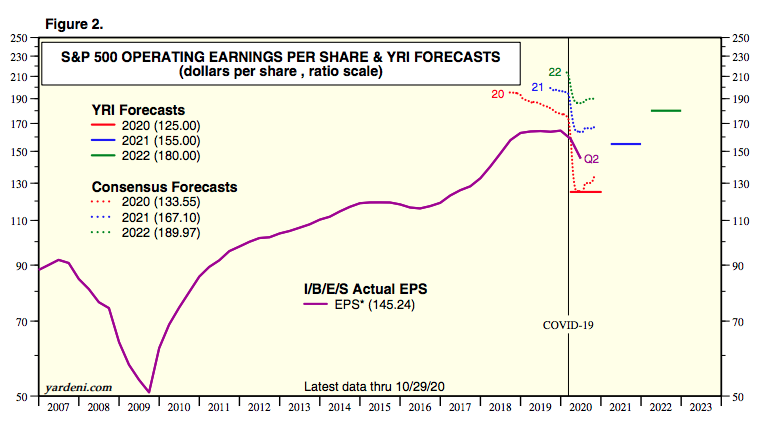
As shown in the chart above, FY2020 consensus analysts estimates call for EPS of $133.55 versus the prior week at $132.13. That is a substantial, positive revision, recalling that back in April Goldman Sachs base case for EPS was $110 a share in EPS for FY2020.
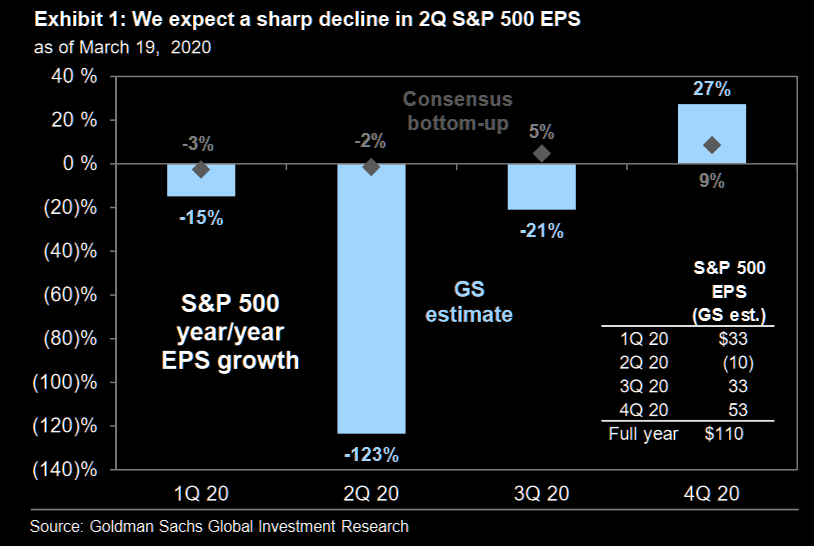
I guess we should give a pass to Goldman for underestimating the powers of fiscal and monetary policy when combined with an elevated Personal Savings rate and stable household balance sheet carried over from the previous expansion cycle. It's a lot to forgive, but as they say; forgiveness is...
As it pertains to valuations, given this seems to be the hesitation for many investors to increase equity market exposure during the infancy stage of an economic recovery cycle still plagued by relatively high valuations and a spike in the infection rate, I present the following chart:
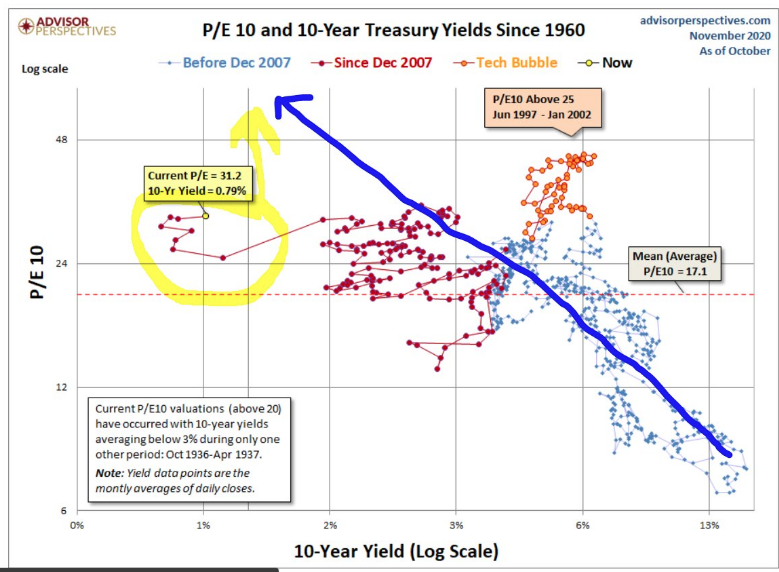
What the chart outlines is the trend of the S&P 500 Price-to-Earnings (PE) multiple across the path of a decline 10-Year yield. As the yield for the safe-haven Treasury has fallen over time, the S&P 500 PE has risen. With a 10-year yield below 1%, therefore, it should be unsurprising that the S&P 500's PE is above its 5 and 10-year average PE. Some might say this is to be expected and on-trend!
For those who remain caught up in the Nasdaq's material outperformance and the mega-cap Tech names with outsized valuations compared to their peer big-cap stocks, here's another way to parse the difference today with that from the 1990s and even 1970s from Jurrien Timmer of Fidelity. He calls it the Nifty Fifty Study:
"The Nifty Fifty study compares the current market leadership to the lopsided leadership of the late 1990s and the original Nifty Fifty era of the mid-1970s. The bottom line in that article was that the spread in valuations between the top 50 stocks in the S&P 500 and the bottom 450 is notable today but nowhere close to the spread during the dot-com bubble.
Interestingly, with data now through Q3, the top 50 stocks in the S&P 500 have continued to lead in terms of return but are actually slightly cheaper now in terms of valuation. It shows the power of earnings in driving stock prices without necessarily inflating price-to-earnings (P/E) multiples.
The chart below shows that the Nifty Fifty now comprise 58% of market capitalization. That’s very close to the dot-com peak in 2000.

Get Over This Last Hurdle
With roughly 2 months left in the year, the S&P 500 broke below 2018 lows and hit record-levels in the span of 6 months. If that's not enough to get you excited for the future of the stock market's potential then I don't know what will. But maybe it's this....

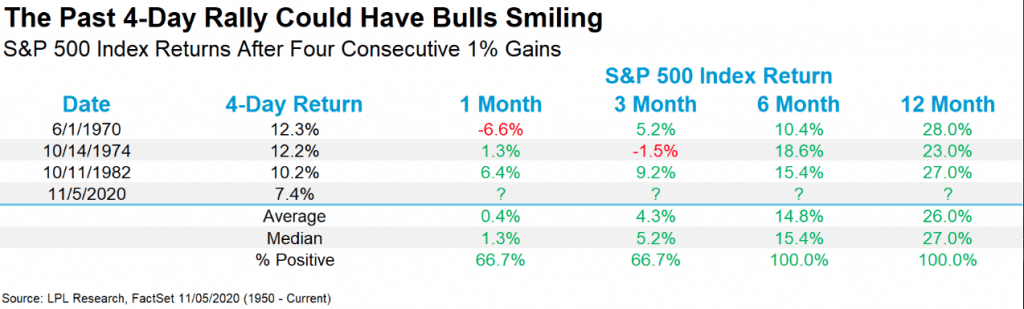
They always make a big fuss about “Sell in May and Go Away”, but rarely do you they tell you to “Remember to Buy in November”. Or as Jeff Hirsch, of the Stock Trader’s Almanac, likes to put it, “Buy in October and Get Yourself Sober”. We have entered the best 3 and 6-month period to own stocks historically, which kicked-off in November. Had you bought, like Hirsch said and Finom Group did in October, you would already be benefitting from this past week's 7%+ rally. Clearly, there is still time to become a dip buyer.
Moreover, within the “Best 6 Months” of the year, you have an even sweeter spot: November – January, as offered by Steven Strazza of All Star Charts.
"The way I see it, if stocks couldn’t fall during what is historically the worst time of the year, imagine how they’ll do during a time where they’re actually supposed to go up!"
Here’s how stocks did during the “Worst 6 months” of 2020:
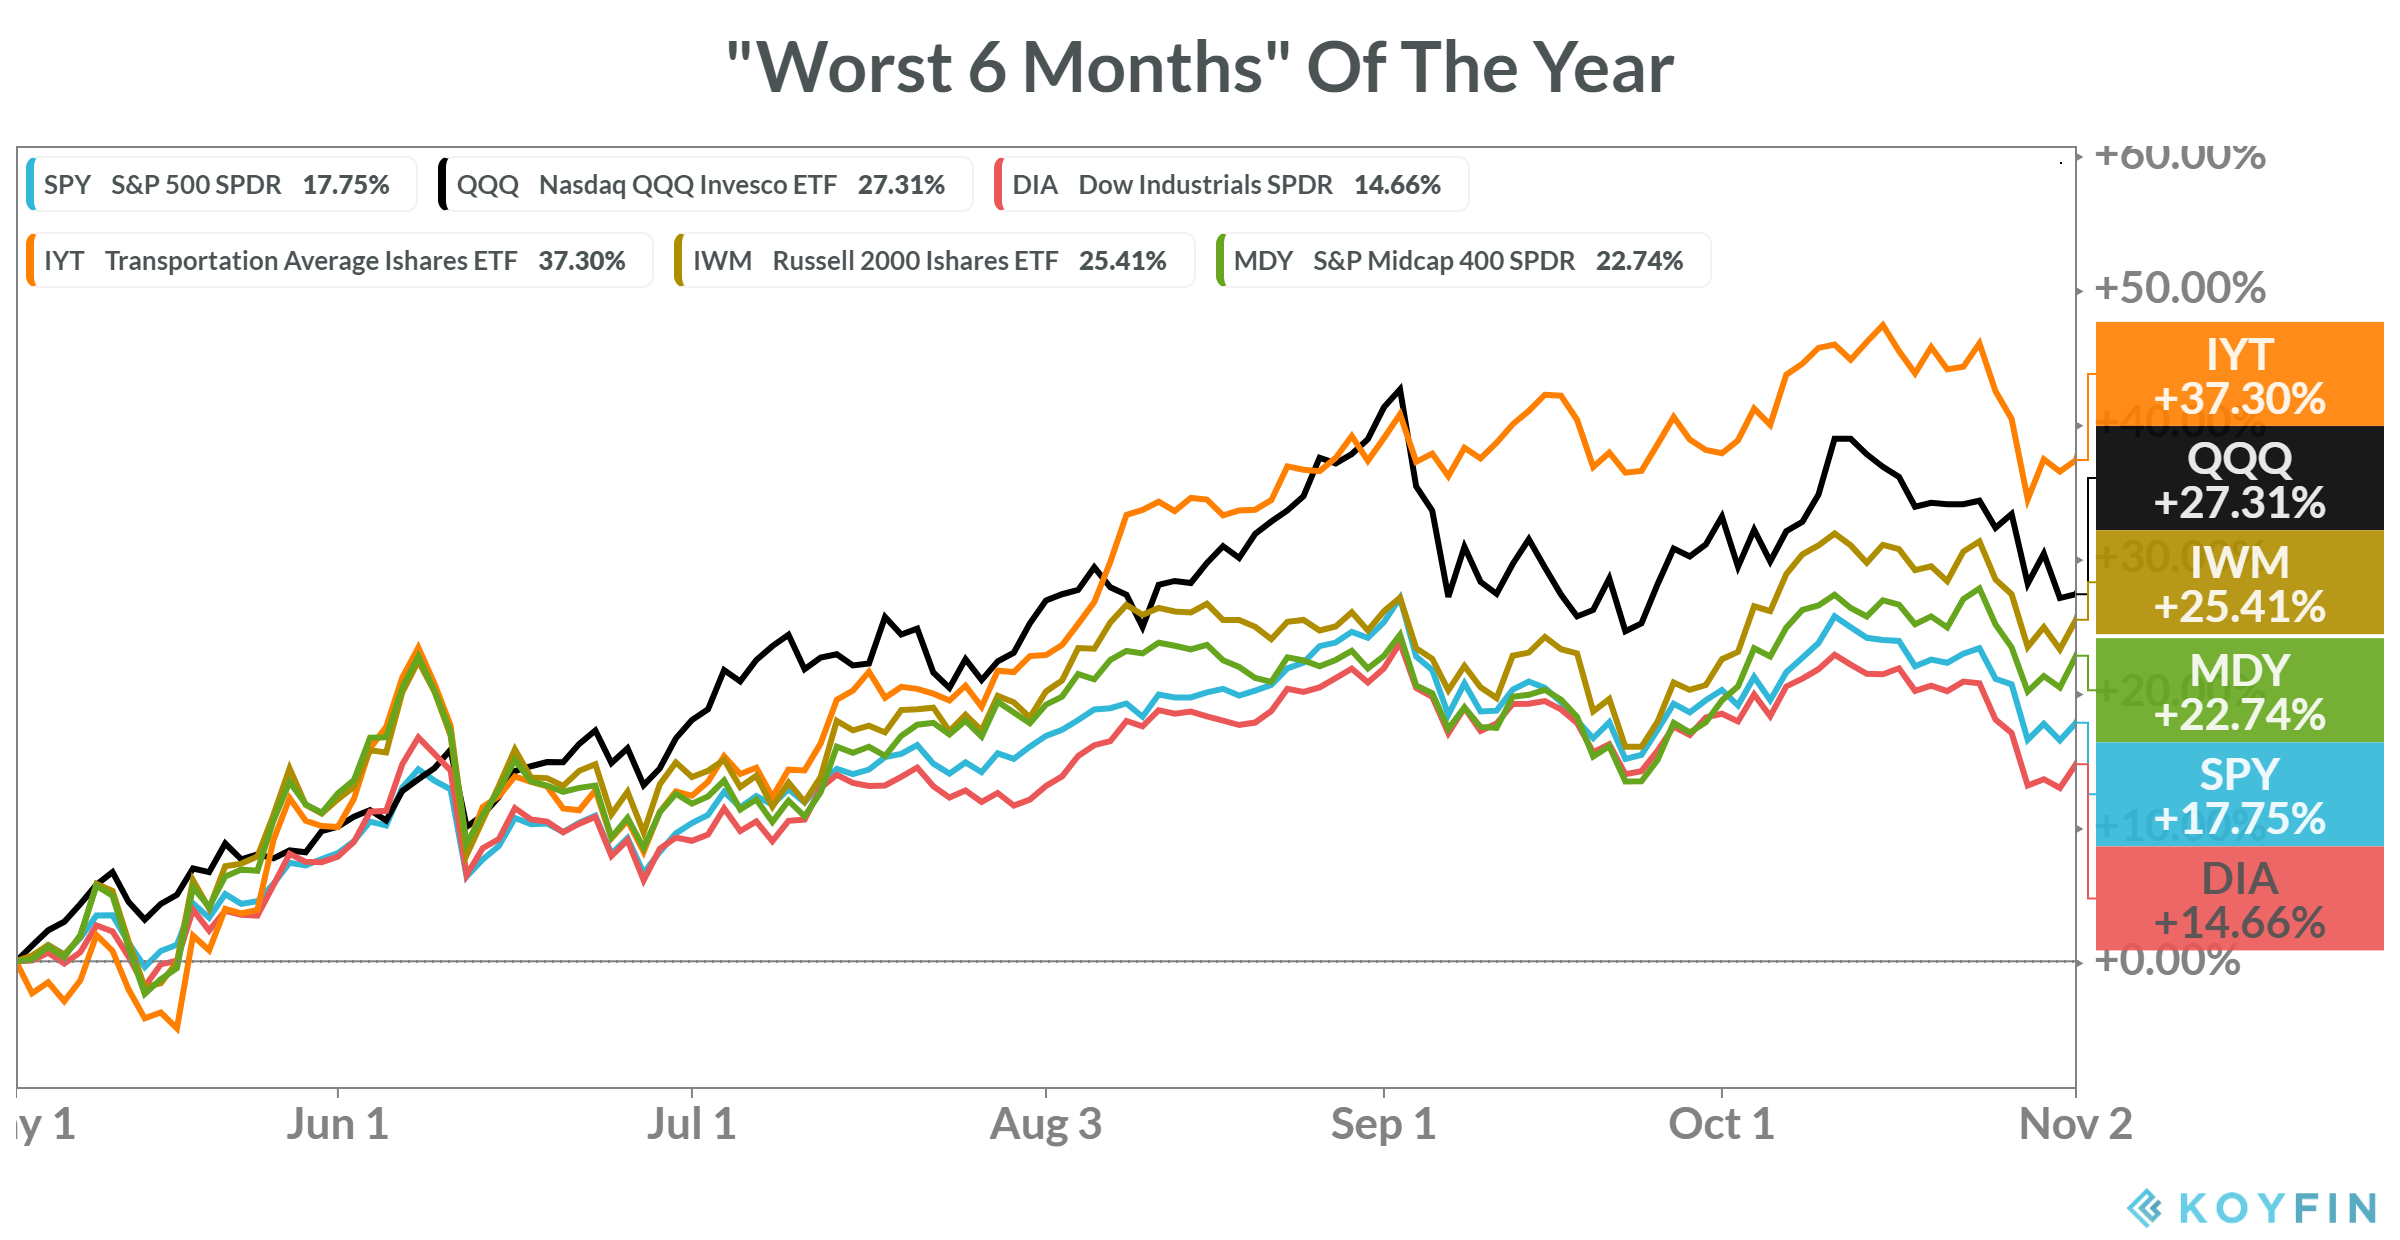
All the major U.S. Indexes were up double-digits. The Dow Jones Transportation Average was up over 37% and the Nasdaq 100 was up 27 percent. As of November 6th and 3 days after an election most people thought would be "insane" in some way, the S&P 500 is 1.7% off its all-time high. Investors will perform better if they stop trying to predict the future, manage their emotions better (if you can't get help), and let the investment returns slowly grow over time.
The past is the past, the present is a gift and the future may prove uncertain, but we know one thing for sure; we can't live in the past and we have to plan for the future. Following a complete wipeout of global indexes in March, more than 60% of major country indexes are now in uptrends. (Chart below)
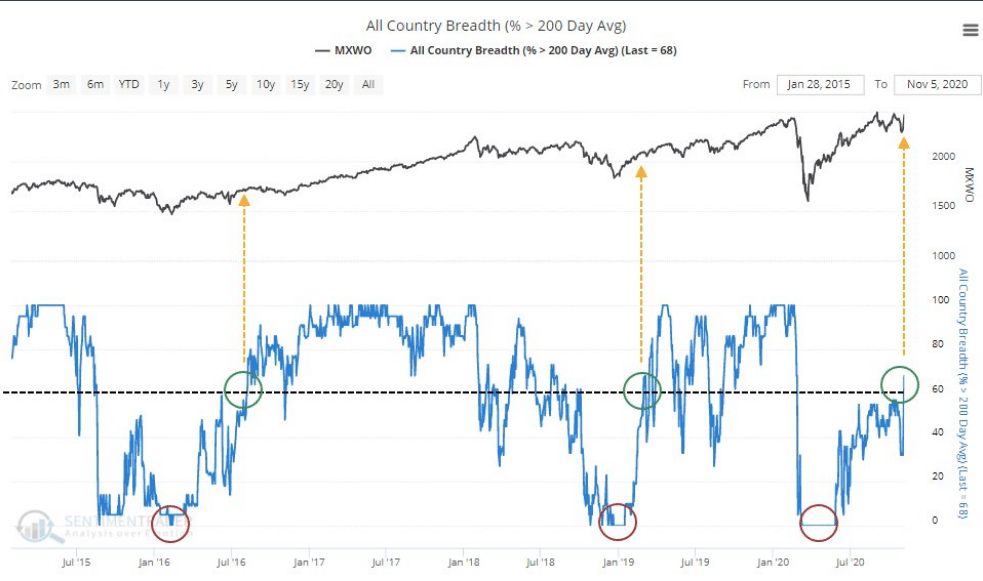
Investors around the world are considering the future. It took a while, but this tends to be a notable threshold for lasting recoveries that start with the market moving off the lows and continues with the market moving higher over time.
Time for some more historic data, as it pertains to the markets and the election period. Always remember that history is not a guarantee of future results, but the probabilities help align our capital allocations for the most probable outcome.
- When the S&P 500 rallied the day after a presidential election, it was higher 3 months later 90% of the time by an average of +4.4%.
- When it dropped the day after, then it was higher 3 months later only 50% of the time with an average return of -0.9 percent.
- The S&P 500 gained +7% this past week. Aside from election week 2008, that has lead to more gains thereafter.
As we complete our weekly Research Report Saturday afternoon, the final count and outcome of the U.S. Presidential Election was declared in favor of Joe Biden. I'm doubtful a concession from President Donal Trump will be forthcoming, without litigation firstly. Nonetheless, here are some possible scenarios for 2021 and as we look to the future. The analysis here is based on historical market performance during the most likely political alignments for next year. (Stock Trader's Almanac)
As promised, and this is exciting if it should come to pass, more on the potential Zweig Breadth Thrust. We last witnessed a Zweig Breadth Thrust in the second trading week of January 2019, coming off of a disastrous Q4 2018 market environment. I wrote about the Zweig Breadth thrust in Finom Group's January 13, 2019 Research Report, which articulated the statistical findings for Zweig Breadth Thrusts so as our subscribers could better understand the powers of such a breadth thrust.
- Since 1962, there have only been 11 Zweig breadth thrusts. (not including the January 2019 occurrence)
- The forward results are impressive when this occurs. Since 1970, the S&P 500 has continued to rally every time over the next 20 days by a median of about 6% (table from Quantifiable Edges).
There are a lot of interesting stats on how the S&P 500 performs going forward after a Zweig Breadth Thrust occurs. As it pertains to what matters most near-term, we’ll simply outline the occurrence within the context of a double-bottoming process or even a lower low for the S&P 500.
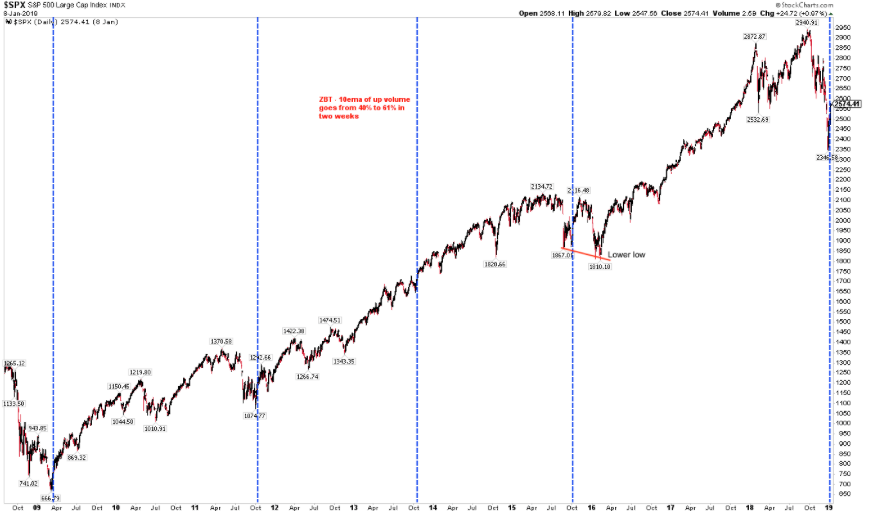
Of the 11 Zweig Breadth Thrusts in the past 60 years, only one (in 2015) was followed by a lower low before a new high was achieved. In that one instance, the February 2016 low was just 2% below the low on August 2015 (closing basis). Importantly, in between those two dates, SPX came within 1% of its all-time high from May 2015. Historically, only have 1 lower low after a Zweig Breadth Thrust helps to define risk near term and with a good deal of statistical probability.
We all know what happened in 2019 from that January Zweig Breadth Thrust onward. The S&P 500 rallied another 25% into year-end and through much of February 2020. Recalling what was stated earlier in this Research Report now:
- To get a Zweig Breadth Thrust signal, that ratio needed to go from below 0.40 to above 0.615 in 10 trading days or less. (2 trading weeks)
- There remains the potential for a breadth thrust in the coming week.
- The chart below is as of the week ending 11/6
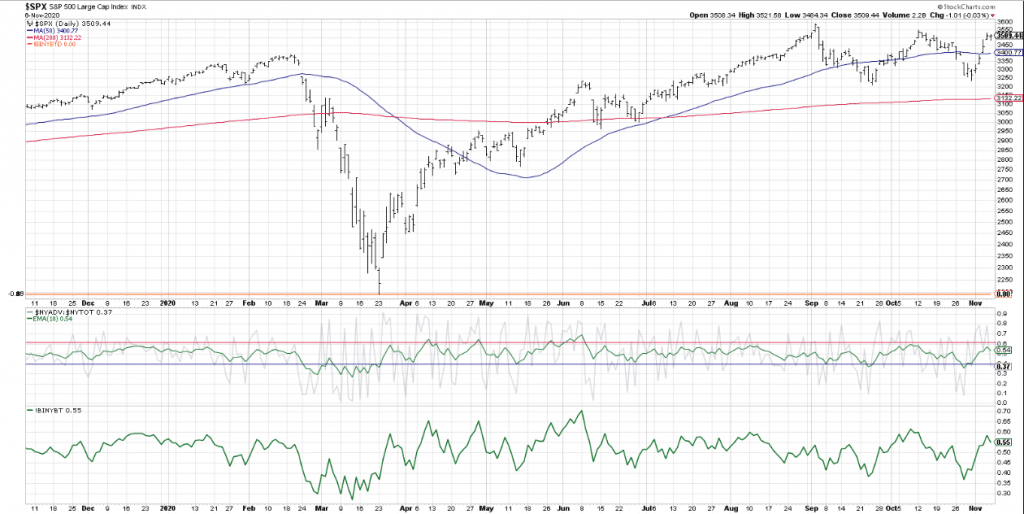
- We are looking at is the middle panel of the NYSE A/D 10-EMA
- If it moves from the current .54 to above .615 by Thursday this coming week, a Zweig Breadth Thrust will occur.
- Finom Group will provide the alert to subscribers should a Zweig Breadth Thrust occur.
There is always a cloud of uncertainty surrounding the market, but with the election now having taken place, and a victor determined, investors can breathe a little easier. There is one layer of uncertainty removed, even if temporarily. What may matter most to investors is the Fed, even over the President. The most powerful person in Washington is still the Fed Chair.


