
Clear Signals For Volume Traders On The Weekly And Daily YM Emini
(Click on image to enlarge)
Last week’s move lower in the indices, and in particular on the June contract of the YM would not have come as a great surprise to traders and investors who apply volume price analysis as a methodology, and this was for several reasons.
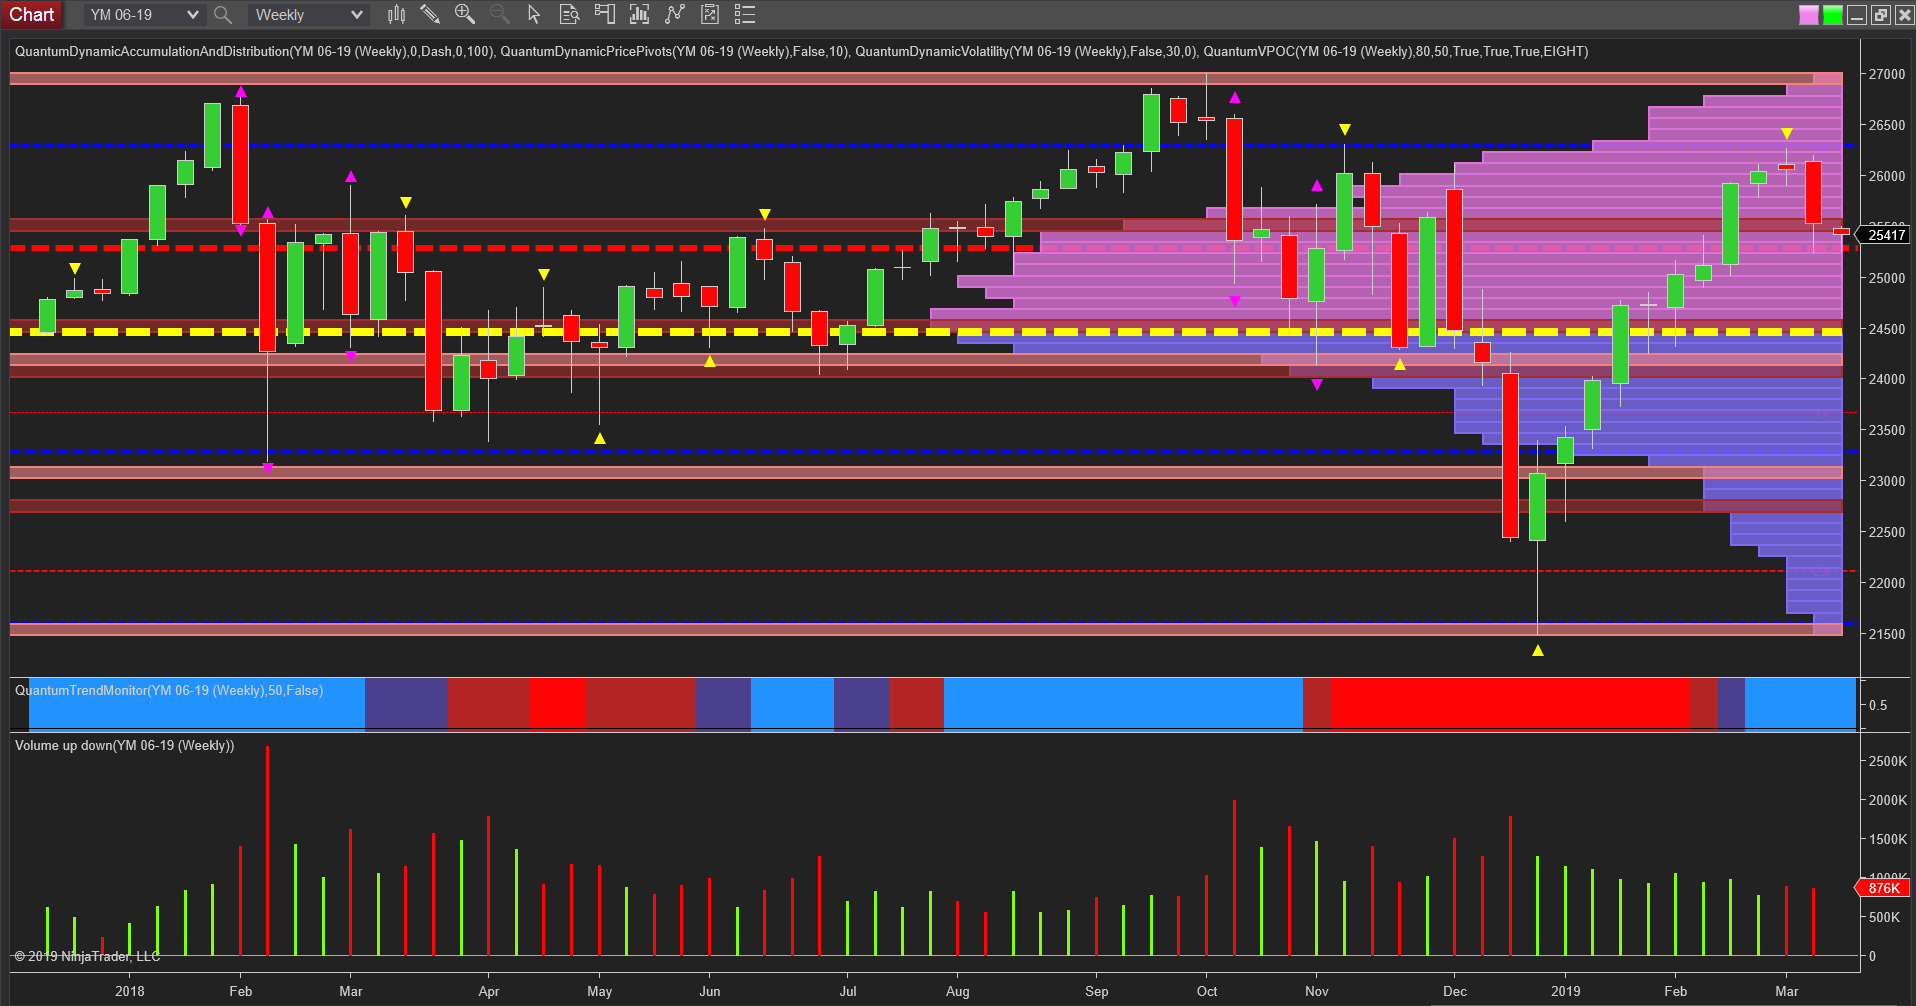
First since the start of the year and indeed more pertinently volume in the rally from 22500 to 26000 has been declining steadily as the index moved higher without pausing or reversing as we can see on the weekly chart. The two candles of most interest are in the final weeks of February and in particular the relationship between price and volume. The first candle was a widespread up candle on solid volume which was in line with previous benchmark candles. However, it was the following candle and associated volume which suggested weakness on the horizon with a narrow spread doji candle formed on marginally less volume. This in itself suggested a market that was running out of momentum with the big operators selling into weakness, even though the candle closed with a positive body. The subsequent candle (Feb/Mar) reinforced this sign of weakness with a further doji candle on high volume. On this occasion the body of the candle was negative and in addition, ran into the resistance 26300 area as
Second, this rally also ran into the price resistance in the 26300 area and denoted by the blue dashed line on the accumulation and distribution indicator. This was a level that had been tested in late 2018 when it held firm.
Last week’s price action then saw the index fall before rallying on Friday to close the week at 25528. However, in early trading on Globex, the YM has fallen as a result of a sharp sell-off in Boeing stock and taken the index down to the strong platform of support in the 25300 region. Should this level be breached we could see a return to the volume point of control which sits below at 24500 and as indicated by the yellow dashed line.
(Click on image to enlarge)
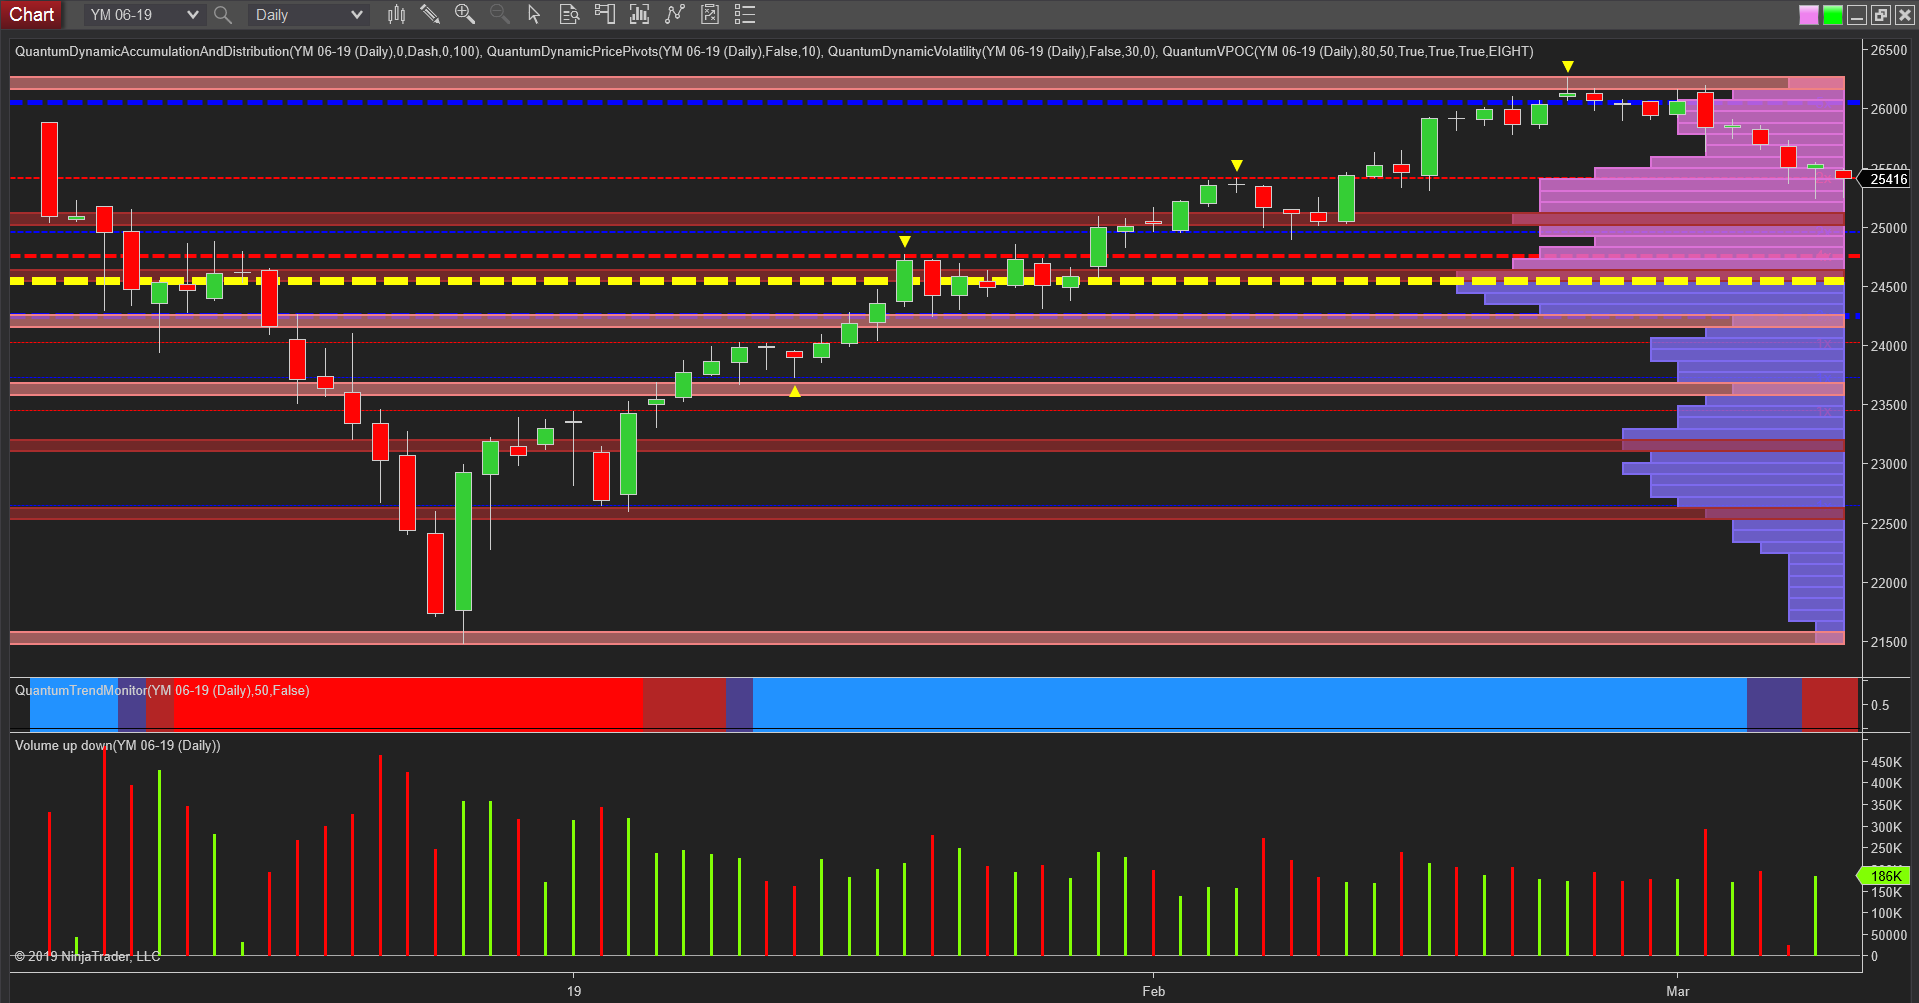
However, on a more positive note and moving to the daily charts for all three indices Friday’s price action closed on hammer candles on good volume suggesting we may see a return to positive sentiment for US equities early in the week.
Disclaimer: Futures, stocks, and spot currency trading have large potential rewards, but also large potential risk. You must be aware of the risks and be willing to accept them in order to invest in ...
more

