
Chink In Small-Caps’ Armor
Some early signs of fatigue are showing up on the Russell 2000, which has more than doubled since March. Conditions are extended. A week ago yesterday, the small cap index was 34.7 percent above its 200-day. Although this in and of itself does not mean the prevailing overbought conditions unwind right here and now, this comes at a time when there are hues of speculation in both options and margin debt.
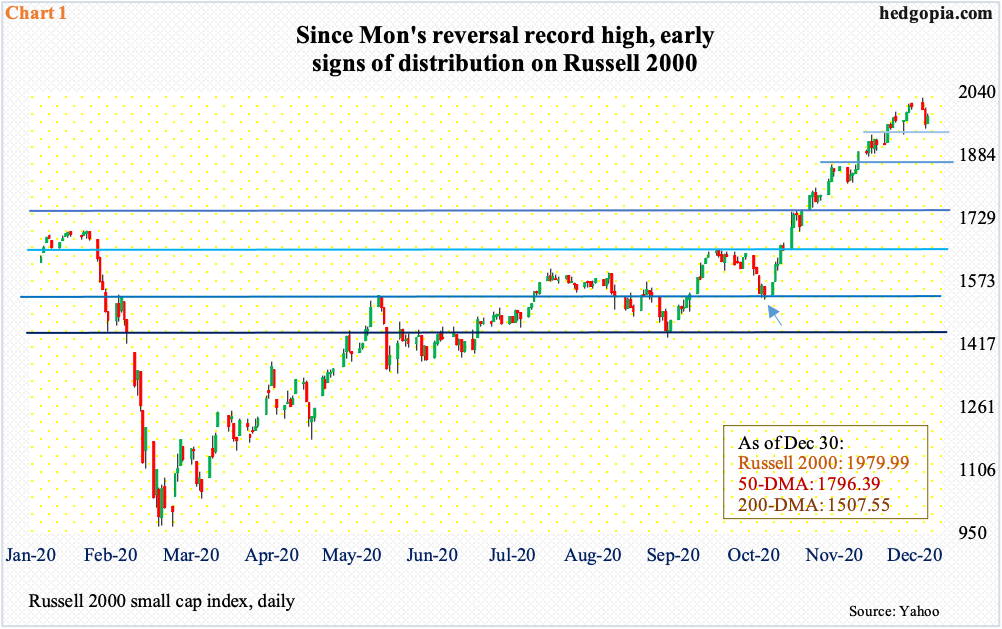
There is a chink in small-caps’ armor. After more than doubling since bottoming at 960s in March, the Russell 2000 (IWM) this week showed early signs of distribution. Monday, the small cap index posted a new all-time high of 2026.24 but only to reverse and close the session down 0.4 percent to 1996.25. This was followed by a 1.8-percent decline on Tuesday and a 1.1-percent rally on Wednesday.
Tuesday’s low of 1950.82 was bought. The 20-day lied at 1933.10 then, and bulls obviously were not ready to lose that average that easy. There is also short-term horizontal support at 1930s (Chart 1). Wednesday, the Russell 2000 (1979.99) closed essentially at the 10-day. Inability to recapture the average will raise the odds that the 20-day will be the next victim, a development that likely shifts momentum to bears’ favor – at least in the short term.
Conditions are extended.
Particularly after bottoming in late October, the index just about went parabolic (arrow). In between, bulls not only reclaimed 1600-plus, which goes back to January 2018, but also 1740s, where it peaked in August that year.
Investors began to gravitate toward small-caps post-November 3 presidential election, and particularly after Pfizer (PFE) and Moderna (MRNA) delivered positive vaccine news – on the 9th and 16th last month, respectively.
The vaccine news has meaningfully raised hopes that the US economy would get back to normal next year. By nature, small-caps are more domestically exposed than their larger-cap cousins, which also have international exposure.
The sell-side is gung-ho about next year. S&P 600 Small Cap companies are expected to earn $55.51 in operations, versus an expected loss of $4.86 this year (courtesy of S&P Dow Jones Indices).
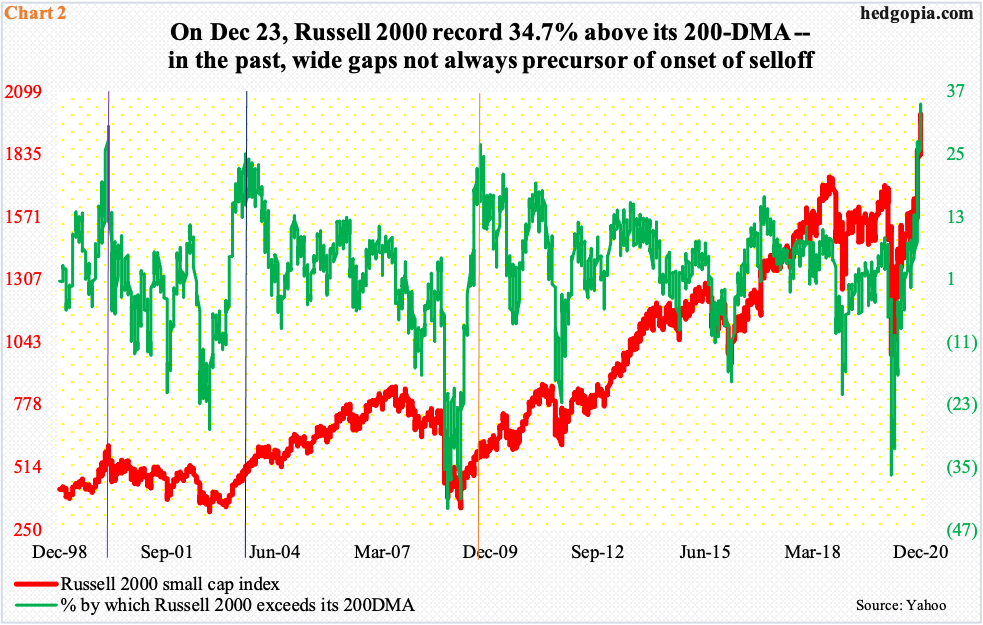
As far as stocks go, there is a fear-of-missing-out phenomenon at work. On Wednesday last week, the Russell 2000 was 34.7 percent above its 200-day – a record; this Wednesday, this stood at 31.3 percent.
There have been several instances in the past when the index opened up a wide gap with its 200-day, including the three that are highlighted in Chart 2.
On March 9, 2000, the Russell 2000 exceeded the average by 30.4 percent, which at the time was a record (violet vertical line); as it happens, the Russell 2000 peaked in the very next session, setting in motion a bear market. On September 8, 2003, the index once again was 25.2 percent away from the average (blue vertical line); this time, however, it rallied for seven more months before peaking in April 2004. Again, on September 16, 2009, the 200-day was 27 percent below where the index traded (orange vertical line). And again, it rallied for seven more months before peaking in April 2010. In other words, wide gaps with the 200-day do not immediately lead to a selloff. It did in 2000, but not in 2003 and 2009.
This much we know. The wider the gap, the higher the risk of a mean reversion – eventually. Hence the importance of this week’s action. Bulls cannot afford to lose momentum – not particularly when several risk-on metrics have risen to a potentially dangerous level.
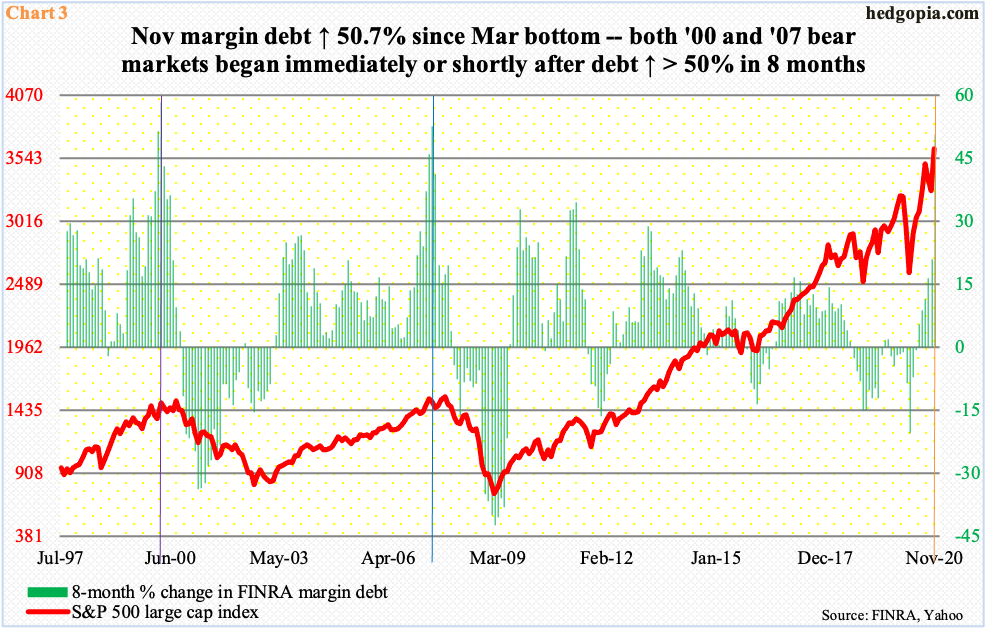
Take a look at FINRA margin debt. In November, it shot up $62.8 billion month-over-month to $722.1 billion – surpassing the prior high of $668.9 billion from May 2018 (chart here). In March (this year), both margin debt and the S&P 500 large cap index (3732.04) bottomed – the former at $479.3 billion and the latter at 2191.86 intraday. From that low, margin debt is up 50.7 percent.
Going back to September 1997, there have been four other occasions when margin debt grew in excess of 50 percent over eight months. The prior three were: up 52.6 percent in June 2007 (violet vertical line in Chart 3), up 51.4 percent in February 2000 and up 58.3 percent in March that year (blue vertical line). In 2000, the S&P 500 peaked in March and in 2007 in October. Both were major peaks, marking the onset of a bear market. So, November’s jump could prove to be important. Time will tell.
This is coming at a time when several options-related metrics are showing massively bullish optimism, including the CBOE equity-only put-to-call ratio as well as the ISEE index, equity only (more on this here). Concurrently, in a sign of increased retail participation, the percentage of small trades is on the rise. As are short-dated contracts, betting the uptrend in stocks continues at least near term. Traders are both buying calls and selling puts; market makers adjust to this by lowering the implied volatility of the puts more than of the calls. The put-to-call skew is low – even negative in some instances. These are all signs of the times – the prevailing bullishness out there. This does not mean such investor behavior has to stop right away but is definitely worth keeping on the back of one’s mind – along the lines of how small-caps and margin debt are behaving.
This blog is not intended to be, nor shall it be construed as, investment advice. Neither the information nor any opinion expressed here constitutes an offer to buy or sell any security or ...
more

