
China And The Fed Inject New Fear Into A Cautious Market
Volatility suddenly returned with a vengeance last week – to both stocks and bonds. In fact, on Wednesday, while the -3.1% single-day selloff in the S&P 500 didn’t quite equal the -4.1% fall on February 3, the normal “flight to safety” into US Treasuries when stocks sell off didn’t occur, which was quite distressing to market participants and pundits alike. But on Thursday, bonds caught a bid while equities continued their fall. Suddenly, talk has become more serious about the potential for slower global growth due to rising interest rates and escalating trade wars.
But has anything really changed from a fundamental standpoint? I would say, absolutely not. Although the risk-off rotation since June 11 continues to hold back Sabrient’s cyclicals-oriented portfolios, our quantitative model still suggests that little has changed with the fundamentally strong outlook characterized by global economic growth, impressive US corporate earnings, modest inflation, low real interest rates, a stable global banking system, and historic fiscal stimulus in the US (including both tax relief and deregulation). Moreover, it appears to me that equities are severely oversold, and now is a good time to be accumulating high-quality stocks with attractive forward valuations from the cyclical sectors and small caps.
When a similar correction happened in February, the main culprits were inflation worries and hawkish rhetoric from the Federal Reserve regarding interest rates. After all, the so-called “Fed Put” has long supported the stock market. But then the Fed commentary became less hawkish and more data-driven, which was helpful given modest inflation data, but the start of the trade war rhetoric kept the market from bouncing back with as much gusto as it had been displaying.
So, what caused the correction this time? Well, to an extent, bipartisan support for heightened regulation and consumer privacy protections hit some of the mega-cap InfoTech stocks that had been leading the market. But in my view, the sudden spikes in fear (and the VIX) and in Treasury yields and the resulting rush to the exit in stocks was due to a combination of the Federal Reserve chairman’s suddenly hawkish rhetoric about interest rates and China’s extreme measures to offset damage from its trade war with the US.
In this periodic update, I provide a market commentary, offer my technical analysis of the S&P 500, review Sabrient’s latest fundamentals-based SectorCast rankings of the ten US business sectors, and serve up some actionable ETF trading ideas. In summary, our sector rankings remain bullish, while the sector rotation model has switched to a neutral posture due to the recent correction. Read on....
Market Commentary:
As I have discussed in prior commentaries, the market has not been behaving quite the same ever since the February correction. And then on June 11, a sudden and significant “risk-off” shift in investor sentiment emerged, as global investment capital rotated out of “risk-on” market segments (like US small caps, industrial metals, commodities, emerging markets, and international developed markets) and into the perceived safety of US large cap equities. And within the large caps, capital rotated out of economically-sensitive cyclical sectors like Materials, Steel, Homebuilding, Energy, Industrials, Financials, and Semiconductors and into defensive sectors like Utilities, Telecom, and Consumer Staples – even as the major cap-weighted market indexes continued to hit new highs.
This was not a “healthy” rotation, in my view; so not surprisingly, this sudden bout of investor caution and defensive sentiment ultimately turned last week into a full-scale correction (which, by the way, I think likely has run its course). Let me expound a bit on those two main culprits (the Fed and China).
A suddenly hawkish Fed:
Regular readers of mine know that I have been in the “lower for longer” camp regarding the 10-year US Treasury yields for a long time (and by the way, lower yields support higher equity valuations). The market dynamics supporting persistent demand for US Treasuries include geopolitical turmoil and aging demographics seeking the safety of the US; divergent central bank monetary policies (with some countries still easing while the US tightens, which strengthened the dollar to the detriment of emerging markets); the relatively higher rates offered in the US; and the structure of large fixed-income mutual funds and ETFs whose mandate is to track the cap-weighted market indexes (i.e., they must buy Treasuries in their proportion to the broad fixed-income market).
And Fed policy seemed to be encouraging this demand for longer-dated Treasuries, given Chairman Powell’s previous comments that as long as the unemployment rate remains low and inflation stable near the 2% target, he didn’t see a need to accelerate his slow-but-steady path of interest rate increases. Moreover, St. Louis Fed CEO James Bullard stated, “The Phillips Curve has disappeared and neither low unemployment nor faster real GDP growth gives a reliable signal of inflationary pressure,” further suggesting the Fed should watch the yield curve in deciding monetary policy. And with the US dollar strengthening and the yield curve flattening in a distressing way, the Fed seemed to be acknowledging the negative impact of divergent central bank policies and signaling a potential slowing of Fed rate hikes. Powell had actually stated that the marketplace seemed to be telling the Fed that it had already brought the fed funds rate near the “neutral rate” (the rate that neither hinders nor stimulates growth). Dovish talk.
But then on October 3, the Fed chairman changed his tune during a PBS interview and shocked the market by opining, “The US is experiencing a remarkably positive set of economic circumstances… There’s really no reason to think this cycle can’t continue for quite some time… The really extremely accommodative low interest rates that we needed when the economy was quite weak; we don't need those anymore… Interest rates are still accommodative, but we're gradually moving to a place where they will be neutral. We may go past neutral, but we're a long way from neutral at this point, probably.” No wonder bonds sold off. Given the vulnerability of a highly-leveraged global economy to the financial burden of rising interest rates, it seems a bit Pollyanna-like to make such a statement. Emerging markets with dollar-denominated debt are particularly vulnerable. But even here at home, interest expense in the federal budget is forecast to be 50% higher next year than in 2017, with interest on the federal debt expected to overtake Medicaid expenditures in 2020.
In response, the normally placid Treasury market suddenly got volatile, with the 10-year T-note yield briefly spiking to 3.25% before closing the week at 3.14%, while the CBOE Volatility Index (VIX) spiked to 28.84 on Thursday before closing the week at 21.31, which is above the 20 “panic threshold.” The 2-year T-note closed Friday at 2.86%, so the closely-watched 2-10 spread is only 28 bps, which means we are still at risk of a “Fed inversion” of the yield curve with the next one or two rate hikes. In spite of this recent surge in rates, I still see plenty of market demand for US Treasuries keeping longer-term rates in check, and modest rates support higher equity valuations. After all, the current forward P/E for the S&P 500 of about 16x equates to an earnings yield of 6.25%, which is about double the 10-year yield. And assuming the P/E remains stable, equity prices should be able to rise along with the rate of EPS growth – which is influenced both by total earnings growth (increasing the numerator of EPS) and share buyback programs (reducing the denominator).
In my view, a gradual rise in long-term interest rates is not a problem for equities, whereas a rapid selloff in bonds that makes yields spike would definitely spook equity investors. But I don’t see such a selloff coming. I think bonds will catch a bid again. Rising Treasury yields should be pushing the dollar to new heights if currency markets truly believed rates were going to remain elevated, so the fact that the dollar is still well below its mid-August high seems to support my view that the selloff in bonds (much like in equities) was technical in nature and not a fundamental reset.
After the latest September rate hike, fed funds now sit in the 2.00-2.25% range (let’s call it 2.25%). CME Group fed funds futures currently place the odds of another rate hike in December at 80%, but interestingly, there is a 49% chance of only one or fewer rate hikes by next September (i.e., a fed funds rate of 2.75% or less).
Extreme measures in China:
Now let’s discuss China’s extreme measures to weather its trade war with the US – a conflict that I think is the greatest threat to the global economy. I have said many times before that a trade war couldn’t come at a worse time for China, but the country is fighting tooth-and-nail to resist US demands to address the blatant inequities that China has long enjoyed and relied upon to stoke its amazing growth rate. Today, the country is burdened with a highly-leveraged and fragile financial system. In response, its government had embarked on a deleveraging campaign, encouraging domestic consumption, and loosening up its capital markets and currency exchanges in order to attract foreign capital, which was encouraging. But now the trade war has further pressured the renminbi, and slowed GDP growth, domestic demand, credit expansion, and export orders, leading the Chinese government to reverse its quantitative tightening policies, injecting liquidity back into the system, cutting taxes, redoubling infrastructure investment, and cutting the required reserve ratio (RRR) for the fourth time this year. Investors are worried, and the Shanghai stock index has fallen to 4-year lows and is down nearly 50% from its mid-2015 peak.
Accordingly, China has continued to diversify its foreign currency reserves by reducing holdings in US Treasuries, and most recently, it announced plans for a modest $3 billion sovereign bond issuance denominated in US dollars (to eliminate investor concerns about currency risk). This spooked the US Treasury market, since such an offering would appear to provide a viable risk-free alternative for global investors (many of whom consider China to be equally creditworthy). The sovereign bond sale is China’s second US dollar bond sale in the past year but only its third since 2004. It comprised 5, 10, and 30-year maturities, with pricing at yields only slightly above comparable US Treasuries and drew strong interest from global investors.
So, while we seem to have come to understandings and a path to new trade deals with Canada, Mexico, Japan, South Korea, and Europe, China remains unwilling to knuckle under to Trump’s tactics – despite the damage being wrought upon its economy and strategic plans. Nonetheless, there is a ray of hope, as President Trump and President Xi are reportedly convening a meeting in late November.
The economy and corporate earnings:
Despite these macro worries about trade wars and interest rates, the US economy keeps humming right along. The BEA’s third estimate of GDP remained at an annual rate of 4.2% for 2Q2018, which is the fastest rate since late-2014. Looking ahead, the consensus among all economists who publish GDP forecasts is +3.3% for Q3. The Atlanta Fed’s GDPNow model as of October 10 forecasts Q3 real GDP of 4.2%, while the New York Fed’s Nowcast model as of October 12 forecasts 2.2% for Q3 and 2.8% for Q4. Any of these numbers look pretty darn good compared with the average annual GDP of 1.48% during 2009-2016.
Yes, there is plenty of talk about a looming recession, with some economists predicting it coming as early as next year. But there are also many prominent voices who are essentially in agreement with my view that we are only in the middle innings of this economic cycle – as the fiscal impacts of deregulation and tax reform are only beginning to ripple through the economy after years of moribund growth supported only by asset inflation from monetary policy (ZIRP and QE). For example, Goldman Sachs stated a few weeks ago that their economic model indicates only a 36% chance of recession in the next three years. Similarly, Northern Trust published its five-year outlook with the view that a recession within that timeframe has odds of only 15-20%. And of course, First Trust has been consistently bullish about an acceleration in economic activity for some years to come.
Unemployment is at 3.7%, the lowest in 49 years (1969!), with hourly wages showing a 2.8% YOY increase, and prior months’ job gains have been revised higher. Workers with only a high school education are enjoying the greatest improvement in opportunities, and African-American unemployment remains near record lows, so the positive impacts have been broad-based. The PMI Manufacturing Index rose and beat expectations, citing strength in new orders and higher backlogs, and ISM Manufacturing remains exceptionally strong. PMI Services and ISM Non-Manufacturing both came in better than expected, with analysts noting record high employment and a 14-year high in business activity. Consumer Sentiment Index came in at a robust 100.1. And small business optimism is in the midst of its longest streak of positivity in history. Moreover, consumer debt has expanded only modestly, while the ratio of consumer debt to income remains reasonable, and the personal savings rate of 6.8% in June is strong.
Looking ahead toward Q3 corporate earnings reporting season that officially begins this week, FactSet indicates consensus earnings for the S&P 500 to increase +19.2% year-over-year (with tax cuts contributing significantly, of course) on +7.3% revenue growth. For Q4, the forecast is for +17.1% earnings growth on +6.3% revenue growth. This compares to roughly 25% earnings growth in both Q1 and Q2 on about +9.0% revenue growth. Moreover, profitability is at an all-time high at around 12%. The Energy sector displays the best year-over-year expected growth for Q3, with +95% earnings growth on +19% revenue growth, while Consumer Staples is the worst at only +5.0% earnings growth on +3.0% revenue growth.
However, it is worth pointing out a concerning piece of under-the-radar news that spooked some equity investors last week. It involved an earnings warning from chemical firm PPG Industries (PPG), which is a $23 billion market-cap specialty chemicals company (Basic Materials sector) that makes and distributes paints, coatings, and specialty materials to a global marketplace. The company warned that earnings would be weaker in both Q3 and Q4 due to higher input costs and reduced international demand. Obviously, this is not the type of news you want to hear from a bellwether company, but it remains to be seen how pervasive is their situation.
What about the flow back home of US corporate capital held offshore to take advantage of the new tax incentives (i.e., 15.5% tax on cash and 8.0% on non-cash or illiquid assets)? Well, of the estimated $3 trillion in corporate cash held offshore, Q1 saw about $295 billion brought home while Q2 saw an estimated $166 billion. According to Strategas Research Partners, this year should see a total of about $700 billion in repatriated corporate profits, $122 billion in individual tax savings, $80 billion in corporate tax cuts, and $100 billion in additional government spending.
And what are companies doing with their cash windfall these days? The actions that reflect the most long-term confidence include capital investment, R&D, M&A, and increased dividends, while share buyback programs generally suggest less long-term optimism, or perhaps suggest caution among corporate chieftains that the “rules of the game” regarding regulation and taxes might be subject to change, or that trade wars might start to take a toll on demand. With that said, share buybacks this year are hitting record levels, with around $190 billion during Q2. However, capex and dividends are also on the rise, with the S&P 500 companies paying out a record high of nearly $112 billion in dividends during Q2. In addition, M&A deal volume in the US was estimated at $368 billion during Q3. Capital spending by S&P 500 companies during 1H2018 totaled $341 billion, which is up 19% year-over-year, partly spurred by accelerated depreciation (part of the new tax law). R&D spending was up 14% YOY during 1H2018 to $147 billion. These growth rates in capex and R&D are the highest in many years.
Moreover, DataTrek has commented on the efficient conversion of net operating earnings to free cash flow such that corporate earnings quality is quite high, with S&P 500 companies paying out 100% of net operating earnings in dividends and stock buybacks during 2015-2017 (and this year is expected to be the same).
On the negative side of the ledger, however, the cap-weighted S&P 500 Index has significantly outperformed the median stock this year and last year, whereas all other years since 2007 (i.e., 2008-2016) have seen the index perform in line with the median stock. So, performance has been driven largely by a narrow group of mega-cap momentum stocks. In addition, the US federal budget deficit is approaching $1 trillion dollars, and total federal government debt has eclipsed $21.5 trillion. If I were to modernize the famous line attributed to former Republican Senator Everett Dirksen in the 1960’s, he might be saying, “A trillion here, a trillion there, pretty soon you’re talking real money.”
Sabrient portfolios and market outlook:
The defensive rotation since June 11 has been a common theme across all our Baker’s Dozen monthly portfolios, with active returns falling significantly against the benchmark in mid-June. As you might expect during a period of robust economic growth, Sabrient’s GARP (growth at a reasonable price) quantitative model has been pointing us toward the cyclical sectors, like Materials, Steel, Homebuilding, Energy, Industrials, Financials, and Semiconductors. In addition, our portfolios have more pronounced sector tilts away from the benchmark than we had in the past, as most of the Technology sector has not scored as well in our model from a forward valuation standpoint, which adds to the volatility of our portfolios versus the benchmark.
Thus, the S&P 500 benchmark has been able to hold up better (and even move to new highs during September) due to four key aspects:
- a high (25%) allocation to the Technology sector, which our GARP model has not been favoring lately as much as it did in prior years
- persistent strength in mega-cap momentum names like Apple (AAPL), Microsoft (MSFT), and Amazon (AMZN), which are its three largest holdings (11% of the index), and which contributed +1.20% to its return between 6/11/18 and 10/12/18, while the index was down -0.94% (Notably, BlackRock wrote last week that the ten stocks with the best YTD price performance in the S&P 500 have a median forward P/E of 48x, while the median stock in the index has a multiple of just 17x, so GARP qualities have not been an investor priority)
- the ability to retain investment capital while temporarily rotating internally out of the cyclical sectors and into defensive sectors like Utilities, Healthcare, Telecom, and Consumer Staples
- a focus exclusively on large caps, which are generally more defensive than small and mid-caps, while Sabrient's portfolios are all-cap and have focused more on mid and small caps in this strong economy due to the more attractive growth rates and forward valuations
However, the forward earnings estimates from the sell-side analyst community have not dropped, and in many cases, guidance has improved as prices have fallen. Thus, forward valuations for our stocks have become much more attractive. And with the fiscal stimulus boosting a mid-cycle economy that seems ready to finally ramp into a boom phase, cyclicals remain the place to be overweighted, according to our models, and are likely only temporarily underperforming.
Here at Sabrient, we rely on our model, which continues to give us bullish signals. So, David Brown, Brent Miller, and the rest of the team and I maintain great optimism that as strong earnings reports continue to roll in, assuming forward guidance remains solid and the trade war with China shows signs of hope (or at least no further escalation), investor sentiment will come back in line and we will see a “risk-on” rotation back into cyclicals as the market once again rewards solid GARP qualities rather than just the momentum or defensive names. In fact, if you look closely at the performance charts for our Baker’s Dozen portfolios, the brief but significant performance spikes during the summer – generally occurring on announcements of renewed trade talks with China – may have provided a glimpse of that potential. In other words, we think that now is the wrong time to exit our cyclicals-heavy portfolios. On the contrary, it seems like a good to time to be accumulating high-quality stocks with attractive forward valuations.
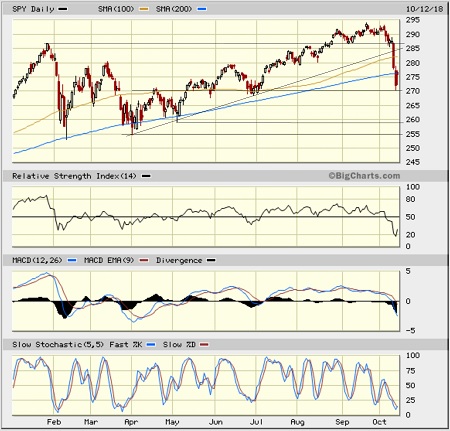
SPY Chart Review:
The SPDR S&P 500 ETF (SPY) closed Friday at 276.01 – which seems a long way from its all-time high of 293.94 set just a few weeks ago on September 20 – essentially giving up in short order all its hard-fought gains from the summer months. As the saying goes, “Stocks take the stairs up and the elevator down.” In retrospect, the defensive rotation was indeed a warning sign of vulnerability. Nevertheless, after cutting through the 20, 50, and 100-day simple moving averages (as well as some breakout levels of resistance-turned-support) like they were soft butter, and then on Thursday falling through the critical 200-day SMA, SPY quickly bounced from the 270 level of strong summer support and recovered the 200-day on Friday while forming a bullish “hammer” candlestick. Oscillators RSI, MACD, and Slow Stochastic are all severely oversold and pointing bullishly skyward.
So, I am confident that we will get a strong (and hopefully sustainable) bounce – preferably this time led by risk-on market segments such as the cyclical sectors (rather than the defensives that led the summer rally). I’d also like to see leadership from small caps, whose swan dive has left the Russell 2000 well below its 200-day SMA, but it seems to have found support at its May low. I said last month that a rotation back into cyclicals will be needed to fortify bullish sentiment and lead a sustained uptrend. We didn’t get it, and instead we got a severe correction.
Latest Sector Rankings:
Relative sector rankings are based on our proprietary SectorCast model, which builds a composite profile of each of over 600 equity ETFs based on bottom-up aggregate scoring of the constituent stocks. The Outlook Score employs a forward-looking, fundamentals-based multifactor algorithm considering forward valuation, historical and projected earnings growth, the dynamics of Wall Street analysts’ consensus earnings estimates and recent revisions (up or down), quality and sustainability of reported earnings, and various return ratios. It helps us predict relative performance over the next 1-3 months.
In addition, SectorCast computes a Bull Score and Bear Score for each ETF based on recent price behavior of the constituent stocks on particularly strong and weak market days. A high Bull score indicates that stocks within the ETF recently have tended toward relative outperformance when the market is strong, while a high Bear score indicates that stocks within the ETF have tended to hold up relatively well (i.e., safe havens) when the market is weak.
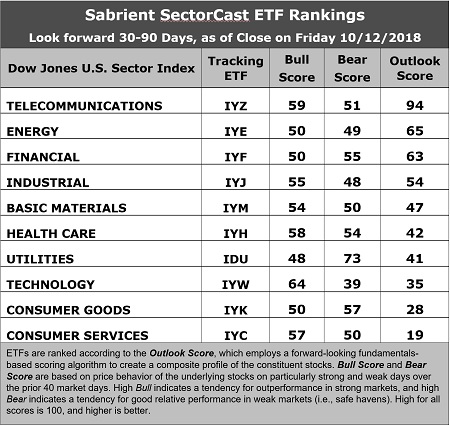
Outlook score is forward-looking while Bull and Bear are backward-looking. As a group, these three scores can be helpful for positioning a portfolio for a given set of anticipated market conditions. Of course, each ETF holds a unique portfolio of stocks and position weights, so the sectors represented will score differently depending upon which set of ETFs is used. We use the iShares that represent the ten major U.S. business sectors: Financial (IYF), Technology (IYW), Industrial (IYJ), Healthcare (IYH), Consumer Goods (IYK), Consumer Services (IYC), Energy (IYE), Basic Materials (IYM), Telecommunications (IYZ), and Utilities (IDU). Whereas the Select Sector SPDRs only contain stocks from the S&P 500 large cap index, I prefer the iShares for their larger universe and broader diversity.
Here are some of my observations on this week’s scores:
1. Telecom retains to the top spot with an eye-popping Outlook score of 94. Telecom displays the lowest forward P/E (14.0x), neutral sell-side analyst sentiment (net revisions to EPS estimates) while most sectors have seen modest reductions to estimates, and the highest return ratios. However, its pure GARP metrics are average, with projected year-over-year EPS growth rate of only 9.0% and a forward PEG (ratio of forward P/E to forward EPS growth rate) of 1.55, which ranks it only 8th out of 10 sectors (this is why we don’t see many Telecoms as candidates for Sabrient’s GARP portfolios). Energy takes second with an Outlook score of 65, displaying by far the best sell-side analyst sentiment, by far the highest projected YOY EPS growth rate of 51%, and by far the lowest forward PEG of 0.32 (this is why we see a lot of Energy candidates for Sabrient’s GARP portfolios), even though its forward P/E is only in-line with the broad S&P 500 at 16.2x. Financial, Industrial, and Materials round out the top five. Technology scores notably weak with an Outlook score of only 35, primarily due to having the highest forward P/E of 18.3 and net downward revisions to earnings estimates. Materials has endured the most downward revisions lately.
2. At the bottom of the rankings we find the two Consumer sectors: Consumer Services (Discretionary/Cyclical) and Consumer Goods (Staples/Noncyclical). Both of these sectors are burdened by net downward revisions to EPS estimates and modest expectations for projected YOY EPS growth.
3. Looking at the Bull scores, Technology enjoys the top score of 64, followed by Telecom and Healthcare, as stocks within these sectors have displayed relative strength on strong market days. Utilities scores the lowest at 48, followed by Consumer Goods (Staples/Noncyclical), Energy, and Financial at 50. The top-bottom spread is 16 points, which reflects moderately low sector correlations on strong market days. It is desirable in a healthy market to see low correlations reflected in a top-bottom spread of at least 20 points, which indicates that investors have clear preferences in the market segments and stocks they want to hold (rather than broad risk-on behavior).
4. Looking at the Bear scores, we find Utilities alone in the top spot with a score of 73, which means that stocks within this defensive sector have been the preferred safe havens lately on weak market days. Technology has by far the lowest score of 39, as investors have fled during recent market weakness, largely due to the high valuations among the mega-cap Tech names. The top-bottom spread is 34 points, which is quite high and reflects low sector correlations on weak market days. Ideally, certain sectors will hold up relatively well while others are selling off (rather than broad risk-off behavior), so it is desirable in a healthy market to see low correlations reflected in a top-bottom spread of at least 20 points.
5. Telecom displays the best all-around combination of Outlook/Bull/Bear scores, followed by Financial, while Consumer Services (Discretionary/Cyclicals) is the worst. Looking at just the Bull/Bear combination, Utilities is the best, followed by Healthcare (which displays the best balance), indicating superior relative performance (on average) in extreme market conditions (whether bullish or bearish), while Energy is the worst.
6. This week’s fundamentals-based Outlook rankings still reflect a bullish bias, given that four of the top five sectors are economically-sensitive (cyclical). Keep in mind, the Outlook Rank does not include timing, momentum, or relative strength factors, but rather reflects the consensus fundamental expectations at a given point in time for individual stocks, aggregated by sector.
ETF Trading Ideas:
Our Sector Rotation model, which appropriately weights Outlook, Bull, and Bear scores in accordance with the overall market’s prevailing trend (bullish, neutral, or defensive), now displays a neutral bias and suggests holding Telecom (IYZ), Energy (IYE), and Financial (IYF), in that order. (Note: In this model, we consider the bias to be neutral from a rules-based trend-following standpoint when SPY is between its 50-day and 200-day simple moving averages.)
Besides iShares’ IYZ, IYE, and IYF, other highly-ranked ETFs in our SectorCast model (which scores over 500 US-listed equity ETFs) from the Telecom, Energy, and Financial sectors include First Trust Nasdaq Smartphone Index (FONE), SPDR S&P Oil & Gas Exploration & Production (XOP), and iShares US Insurance (IAK).
If you prefer a bullish bias (which might be warranted by the extremely oversold conditions and solid fundamentals), the Sector Rotation model suggests holding Telecom, Technology, and Healthcare, in that order. On the other hand, if you are more comfortable with a defensive stance on the market, the model suggests holding Utilities, Telecom, and Financial, in that order.
An assortment of other interesting ETFs that are scoring well in our latest rankings include SPDR S&P Bank (KBE), iShares US Broker-Dealer & Securities Exchange (IAI), WBI BullBear Yield 1000 (WBIG), Davis Select Financial (DFNL), SPDR MFS Systematic Value Equity (SYV), VanEck Vectors BDC Income (BIZD), First Trust Natural Gas (FCG), and First Trust Value Line 100 (FVL).
Disclaimer: This newsletter is published solely for informational purposes and is not to be construed as advice or a recommendation to specific individuals. Individuals should take into account ...
more

