
Canadian Dollar Weekly Price Outlook: Loonie At Turn Or Burn Pivot
In this series, we scale-back and look at the broader technical picture to gain a bit more perspective on where we are in trend. The Canadian Dollar has been fallen more than 8.4% against the US Dollar year-to-date with USD/CAD attempting to rally for the sixth consecutive week. In fact, the price has seen just one down-week since the October 1st low and the immediate focus is on a critical resistance pivot just higher. Here are the key targets & invalidation levels that matter on the USD/CAD weekly chart heading into the close of the year.
USD/CAD WEEKLY PRICE CHART
(Click on image to enlarge)
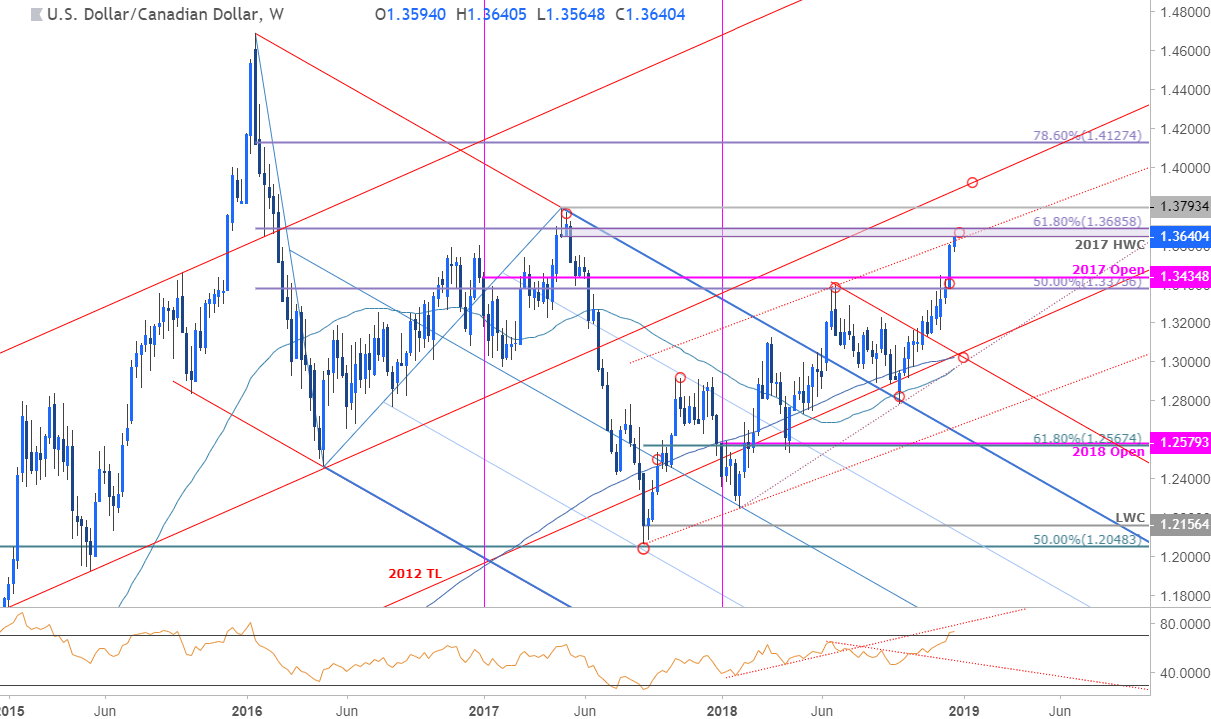
Notes: In our last USD/CAD Weekly Technical Outlook we highlighted that price was approaching, “a key resistance zone at 1.3375-1.3435- a region defined by the 50% retracement of the 2016 decline, the June swing highs and the 2017 yearly open. A breach / weekly close above this threshold is needed to keep the immediate long-bias viable.”
A breakout on December 18th fueled the advance with price accelerating towards the next major confluence resistance zone at the 61.8% retracement of the 2016 decline / 2017 high-week close at 1.3647/86. Note that weekly RSI has just broken into overbought territory and keeps the bulls in control for now- a topside breach from here targets subsequent resistance objectives at the 2017 highs at 1.3793 and 2012 slope parallel, currently at ~1.39. Interim support rests at 1.3375 with broader bullish invalidation down at highlighted confluence zone at ~1.3030.
Bottom line: USD/CAD is testing BIG resistance upper here and a breach/close is needed to keep the broader long-bias in play. From a trading standpoint, the immediate advance may be vulnerable below this threshold- a good place to reduce long exposure / raise protective stops. For now, keep an eye out for possible topside exhaustion while below this critical zone.
USD/CAD TRADER SENTIMENT
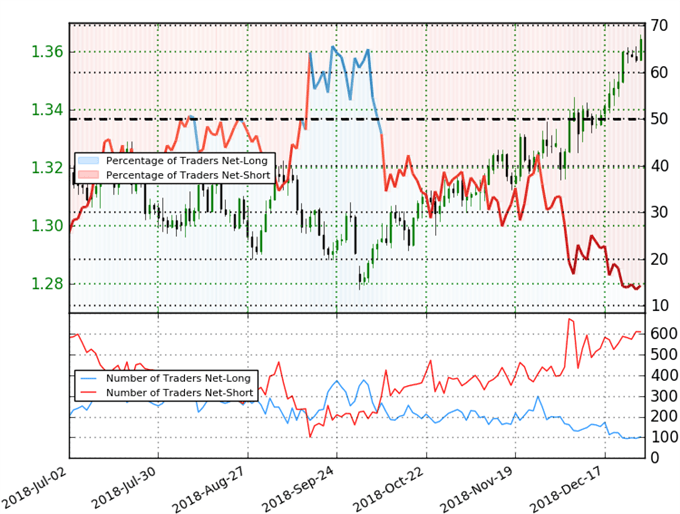
- A summary of IG Client Sentiment shows traders are net-short USD/CAD - the ratio stands at +-5.97 (14.3% of traders are long) – bullish reading
- Traders have remained net-short since October 9th; price has moved 4.7% higher since then
- Long positions are 2.0% higher than yesterday and 18.4% lower from last week
- Short positions are 2.0% higher than yesterday and 3.0% higher from last week
- We typically take a contrarian view to crowd sentiment, and the fact traders are net-short suggests USD/CAD prices may continue to rise. Traders are further net-short than yesterday and last week, and the combination of current sentiment and recent changes gives us a stronger USD/CAD-bullish contrarian trading bias from a sentiment standpoint.
Disclosure: Do you want to see how retail traders are currently trading the US Dollar? Check out our IG Client Sentiment ...
more

