
Canadian Dollar Price Outlook: USD/CAD Breaks Out Ahead Of The Fed
It was a fast start to the day in USD/CAD as the pair pushed up to a fresh two-week-high, temporarily testing above the 1.2800 level ahead of the FOMC rate decision. And this comes after USD/CAD ran into a really big level last week at 1.2622, which is the 50% marker of a long-term major move from 2002 through 2007.
As looked at in the earlier-week analyst pick, that support inflection late last week led into the build of a morning star pattern, which is often approached with the aim of bullish reversals. And this was coupled with another formation of a longer-term, as a falling wedge had formed over the past couple of months. The falling wedge is similarly approached with the aim of bullish breakouts.
USD/CAD DAILY PRICE CHART
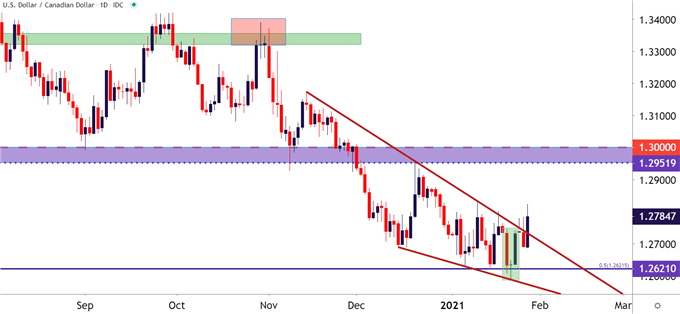
Chart prepared by James Stanley; USDCAD on Tradingview
CAN BULLS PUSH THROUGH FOMC?
While some CAD-weakness has certainly assisted with the topside move so far, the determinant of how far or long that stretch may extend is likely going to draw back to the US Dollar, and whether that theme of strength can continue. And the driver for this will likely be determined by two prevailing forces, and those are both of the Central Bank variety as the Fed goes into their January rate decision a little later today, fresh on the heels of some interesting comments around the European Central Bank. While the ECB had previously showed little worry about Euro appreciation, yesterday’s report of a study being launched to investigate the matter raised some eyebrows.
And given how aggressive that short theme had become in the USD in the back eight months of last year, there could be more squeeze on the horizon and that could further support the bid in the USD. USD/CAD may remain as one of the more attractive venues for such themes, and the big area of interest for resistance potential is around that prior zone of support, spanning from 1.2952-1.3000. This zone provided multiple support inflections over the past few years and most recently gave a bit of resistance in late-December before the pair tumbled down to a fresh two-year-low.
But this key zone has yet to show-up in 2021 trade and should this bullish theme in USD and USD/CAD continue, that could be an attractive spot on the chart to follow.
USD/CAD WEEKLY PRICE CHART
(Click on image to enlarge)
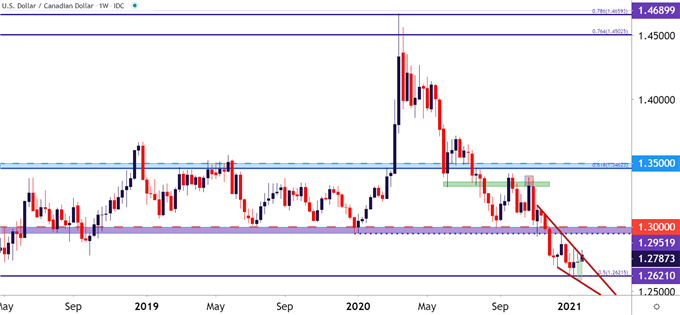
Chart prepared by James Stanley; USDCAD on Tradingview
Disclosure: See the full disclosure for DailyFX here.


