
Canadian Dollar Price Forecast: USD/CAD Ahead Of BoC - Loonie Levels
The next two weeks are key for FX markets and USD/CAD, in particular. The Bank of Canada surprised when they started talking up the prospect of post-pandemic policy in their April meeting. This is a move the Fed still has yet to make and, by most indications, it doesn’t appear that even talking about that is yet in the cards. This set up for a backdrop of a really strong Canadian Dollar to go along with a really weak US Dollar which allowed for USD/CAD to plunge to a fresh six-year-low.
But, as looked at a couple of weeks ago, further progress became a challenge as the 1.2000 psychological level neared, and sellers have yet to test through that level with last week producing a fresh lower-low at 1.2002.
USD/CAD TWO-HOUR PRICE CHART
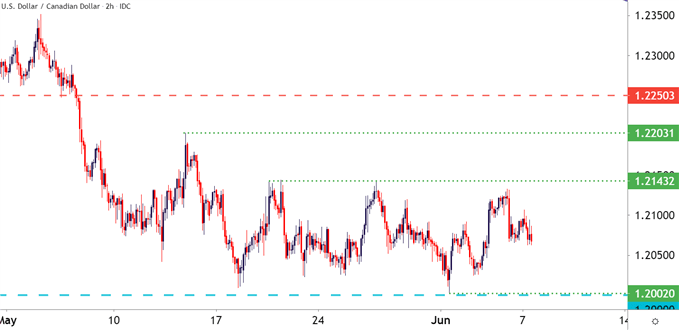
Chart prepared by James Stanley; USDCAD on Tradingview
THIS WEEK’S ECONOMIC CALENDAR
This week’s economic calendar brings the Bank of Canada for a rate decision on Wednesday followed by an inflation printout of the US on Thursday morning. The expectation for that inflation print on Thursday is for 4.7%, which would provide for another jump from the 4.2% read that printed last month.
The bigger question here is whether the Bank of Canada will take further steps towards talking up post-pandemic policy, mainly in terms of rate hikes. And after last Friday’s abysmal jobs numbers, that may not be a pressure point that the bank yet wants to encounter.
This could possibly provide for a backdrop conducive to reversal or pullback themes. The pair remains oversold on a long-term basis and there are two high-impact data points that could threaten to unwind that theme of USD/CAD weakness. This could produce some position squaring ahead of the drivers and depending on how those drivers play out, this could set up for that backdrop to run into the FOMC event in the following week.
USD/CAD DAILY PRICE CHART
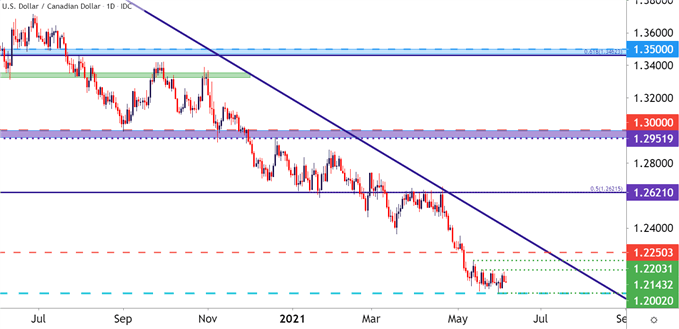
Chart prepared by James Stanley; USDCAD on Tradingview
USD/CAD LONG-TERM: MOST OVERSOLD IN 13 YEARS
From the weekly chart, USD/CAD is at its most oversold level since November of 2007. The spot price was below parity at that point and quite a bit has changed since. But, from the weekly chart below, also notice the continued hold of support around the 1.2000 level to go along with that deep oversold reading. This can further point to the prospect of pullback as we approach a batch of highly-important drivers.
USD/CAD WEEKLY PRICE CHART

Chart prepared by James Stanley; USDCAD on Tradingview
Disclosure: See the full disclosure for DailyFX here.


