
Canadian Dollar Forecast: USD/CAD Bounce From Key Zone - Loonie Levels
USD/CAD put in one of the more concerted sell-offs to go along with the recent theme of USD-weakness. After topping out last March, along with the US Dollar, USD/CAD then went on to spend the next fourteen months in varying stages of a sell-off. While the US Dollar was weak across the board, a strong Canadian Dollar, helped along by rising oil prices, kept USD/CAD pinned below a bearish trendline for much of this time.
In the month of April, this theme caught another shot-in-the-arm as the Bank of Canada started talking about the prospect of post-pandemic policy. The Fed hadn’t yet done so and this deviation created even more motive for USD-bears, and USD/CAD plunged down to a fresh six-year low.
But, it was around that low point on the chart that matters started to shift, and I highlighted this theme in late-May as the pair was starting to look beleaguered after failing to break through the psychological 1.2000 handle.
USD/CAD DAILY PRICE CHART
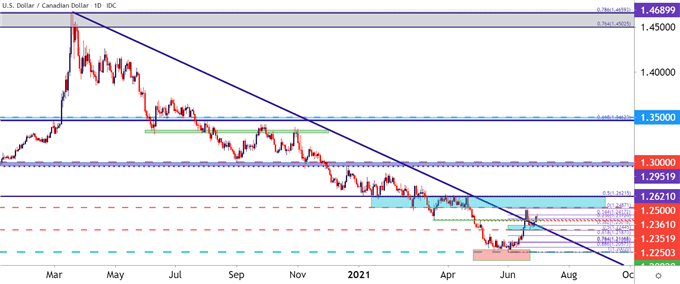
Chart prepared by James Stanley; USDCAD on Tradingview
Prices in USD/CAD has started to show range tendencies ahead of the BoC rate decision in early-June, with USD/CAD showing oversold levels that hadn’t been seen in more than a decade. And when the BoC came out a bit less hawkish than in April, the pair began to trend higher with a touch of additional CAD-weakness; and that led into the FOMC rate decision at which point a surge of USD-strength was now meshed with this CAD weakness to create a strong rally in the pair.
In the aftermath of the FOMC rate decision, I started looking at potential setups for bullish continuation in USD/CAD, in the event that this pullback may turn into something more. I highlighted a zone of potential higher-low support, taken from around the 1.2250 psychological level.
That zone came into play last week and that price of 1.2250 came in to help set the low on Wednesday. Since then, buyers have been pushing a bit harder, creating a short-term higher-high and, as of this morning, a higher-low from the secondary zone of support looked at in that same article.
USD/CAD FOUR-HOUR PRICE CHART
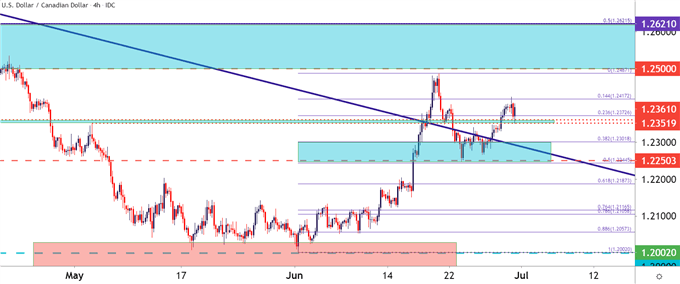
Chart prepared by James Stanley; USDCAD on Tradingview
USD/CAD STRATEGY NEAR-TERM
At this point, USD/CAD holds some allure for long-USD strategies. The 1.2500 level looms above, and beyond that is the 1.2622 Fibonacci level. This is a big zone that took USD/CAD a little over three months to break-below, so if this area does come into play, it could lead to some mean reversion and back-and-forth price action until a more prominent driver becomes clear, and at this point, the best guess on that would be the Jackson Hole Economic Symposium later this summer.
On the underside of current price action, short-term support is currently showing in the 1.2352-1.2361 zone, and below that is the 1.2250-1.2300 zone. If buyers can’t hold up the 1.2250 low, those bullish prognostications may soon come into question.
USD/CAD EIGHT HOUR PRICE CHART
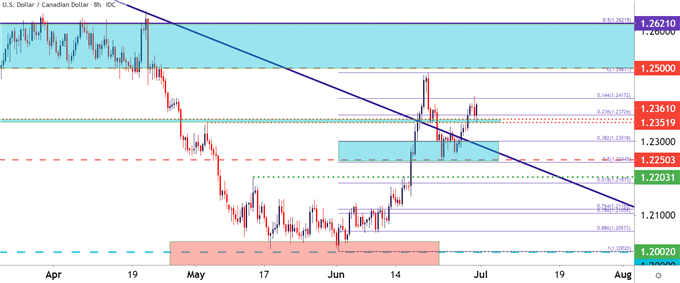
Chart prepared by James Stanley; USDCAD on Tradingview
Disclaimer: See the full disclosure for DailyFX here.


