
Buybacks, Margin Debt Increasingly Headwind Than Tailwind
Stars may be lining up near term for equity bulls, but medium-term worries remain. Margin debt and corporate buybacks are no longer providing the kind of tailwind they did until recently.
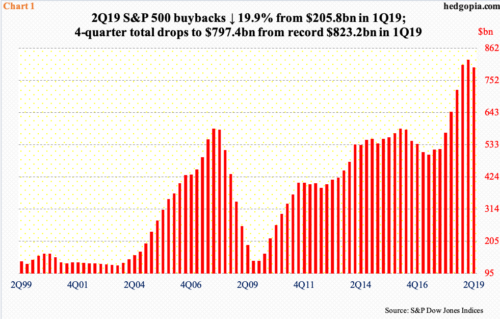
Buybacks simply collapsed in 2Q19. With 94.9 percent of the data in, buybacks by S&P 500 companies declined 19.9 percent from $205.8 billion in 1Q19 (courtesy of S&P Dow Jones Indices). The record high of $223 billion was set in 4Q18. The four-quarter total in 2Q19 dropped to $797.4 billion from record $823.2 billion in 1Q19 (Chart 1).
Post-tax cuts of December 2017, corporate spending on buybacks and dividends shifted into a much higher gear. In 2018, S&P 500 companies bought back $806.4 billion in their own shares and doled out $456.3 billion in dividends – a new record on both fronts. Dividends are still going strong, with a new record of $14.24/share set in 2Q19. But last year’s pace of buybacks is proving to be unsustainable.
Unless absolutely compelled to do so, boards will do their best not to cut dividends. They are cutting where it is relatively easier to do so, which is buybacks. In fairness, the 2Q19 pace is still higher than what these companies spent in 4Q17, which was $137 billion. It is just that when 2Q19 gets compared with the torrid pace of 2018 the decline looks acute.
That said, a decline is a decline, and it will begin to impact stocks, particularly so as buybacks have provided a reliable tailwind.
Then there is margin debt, which, too, is showing signs of cooling off.
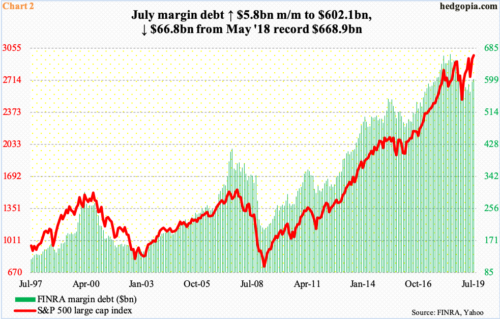
In July, FINRA margin debt rose $5.8 billion month-over-month to $602.1 billion. The S&P 500 large-cap index rallied 1.3 percent in that month, and 6.9 percent in June. Margin debt grew a combined $33.4 billion in those two months.
Here is the rub.
In July, the S&P 500 rallied to a new all-time high, while margin debt was nowhere near its prior high. The latter made an all-time high of $668.9 billion in May last year, which was essentially on par with $665.7 billion in January that year. The S&P 500 peaked in January last year, again in September and again in May this year. Each time, it recovered and went on to post fresh highs. Not margin debt. Historically, the two tend to move together (Chart 2). To that end, it does not take long before what has been a tailwind to turn into a headwind. The same logic also applies to buybacks.
Unless the headwind created by these two metrics gets offset, let us say, by a contraction in money-market assets and/or increased foreign buying of US stocks (more here), bulls medium term may be looking at a tough road ahead.


