
Busting Bond And Stock Market Myths: Weekly Nifty 9
Welcome to another trading week!! In appreciation of all of our daily readers of finomgroup.com content, we offer the following excerpts from our Weekly Research Report. Our weekly report is extremely detailed and has proven to help guide investors and traders during all types of market conditions with thoughtful insights and analysis, graphs, studies, and historical data/analogues.
Research Report Insight #1
We’ve identified individual stocks in previous Research Reports that we deemed reasonable opportunities, and we understand that many Finom Group members have benefited from such dissemination. Below are 2 such opportunities that were outlined in mid-October 2020, which have delivered strong profits since:
“With the Industrials sector having performed very well over the last couple of months, one stock in particular comes to mind; Caterpillar (CAT). This stock recently broke out and above a longer-term trend line.
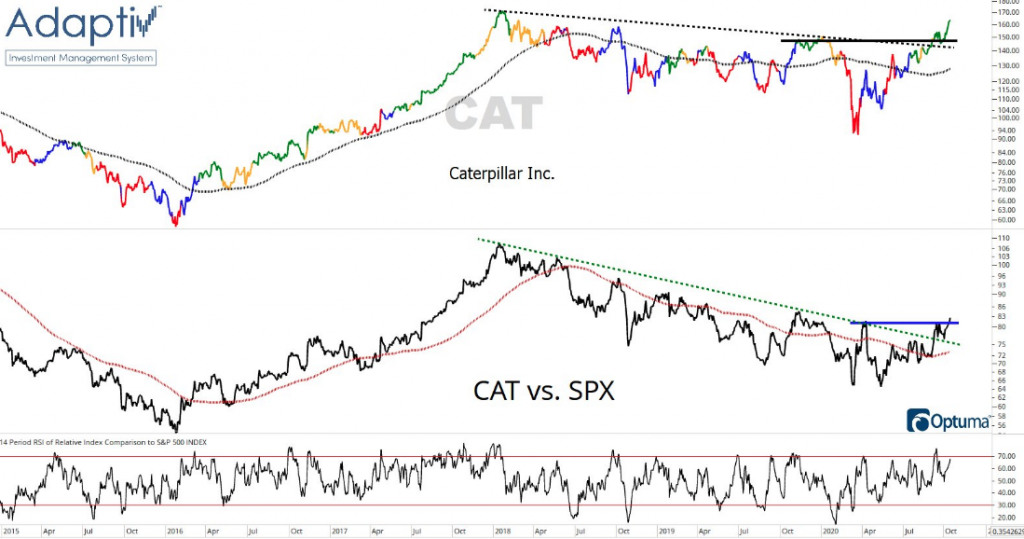
Not only did the stock break above a longer-term trend line, it’s relative performance with the S&P 500 has also broken out to the upside (bottom panel chart). CAT is definitively signaling to investors that the uncertainties of the day hold limited potential to derail the global economy longer-term. Investors have received this message and are signaling a willingness to weather near-term storms in favor of the long-term destination.
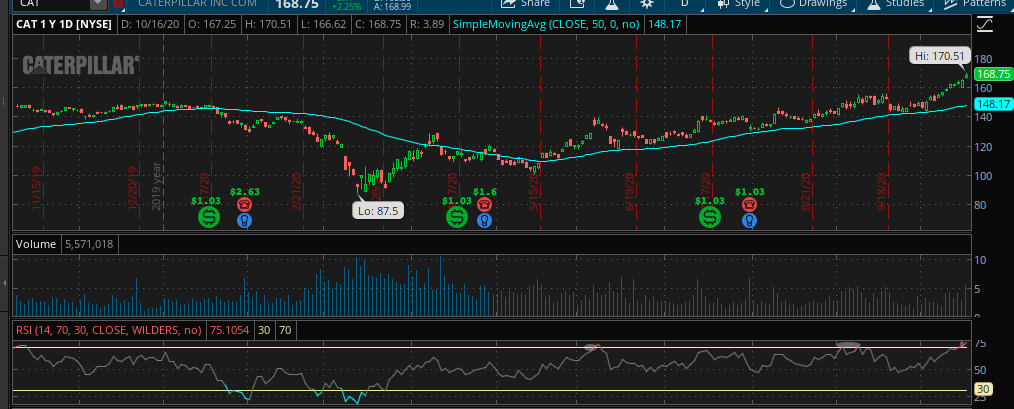
I wouldn’t jump into CAT right away. Like the small-cap ETF, it may prove prudent to set a course of action that includes buying dips, rather than chasing rips to the upside. One of the reasons I offer such commentary is due to the fact that the recent move in shares of CAT is rather parabolic and finds the RSI (14-day relative strength index) has achieved 70, typically an overheated reading that may prove unsustainable near-term.
If small-caps and CAT don’t work for your portfolio, keep in mind that we’ve been highlighting Transports within the Industrial sector ETF (XLI). It may also prove noteworthy that Boeing (BA) is in the large-cap Industrial Sector ETF (XLI). Try as they may to push and keep BA below $160 a share, they have not been able to do so. While the stock has not broken out, does not express strong technicals and has been in a longer-term consolidation phase, it would appear the lows for the CYCLE are in for shares of BA.
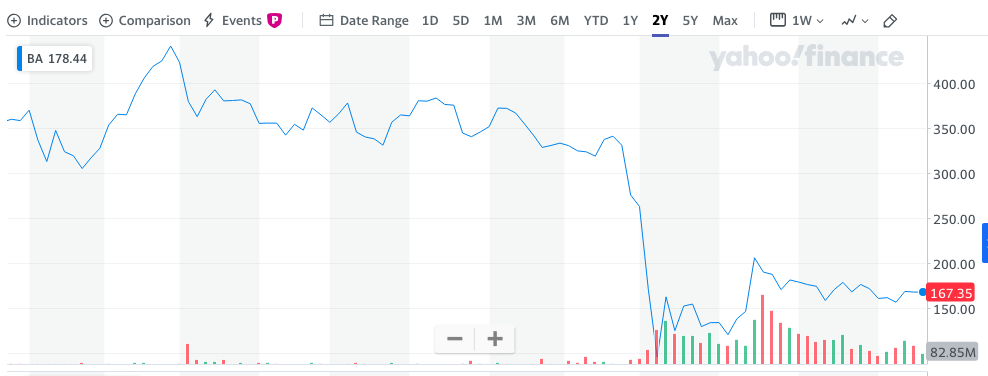
Since Q1 2019, it seems as though everything has been thrown at BA to suppress upward price action in the stock. Nonetheless, the fundamental concerns have only produced a floor for which long-term investors with an optimistic and historic understanding of the Boeing business model are looking to take advantage. I think BA will find share price appreciation through 2021, barring additional and new exogenous force factors on the fundamental business operation. The latest headlines support the fundamental resurgence in 2021.”
As we look forward to more market corrections and opportunity, as the CIO of Golden Capital Portfolio, we have made decisions this past week to take profits in the BA investment, after previously taking some profits in CAT.
Research Report Insight #2
Fundstrat’s chief equity strategist Tom Lee believes that the cyclcial nature and achievements since the most recent S&P 500 consolidation will also propel the index to at least 4,300 in the first half of 2021.
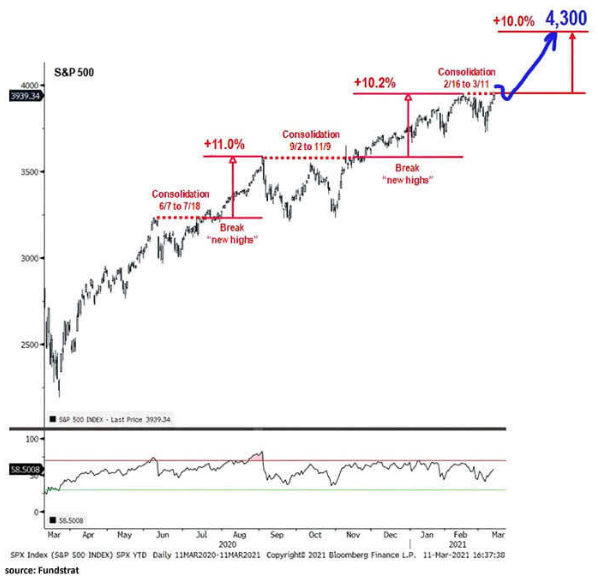
Lee expects the S&P 500 to rally 10% to 4,300 by the end of June, before any potential correction materializes, according to notes to clients. Lee said Thursday’s record highs in the S&P 500 occurred as the VIX is on the decline. To him, that represents “double confirmation” of the move higher in stocks.
Over the past year, periods of consolidation in the S&P 500 have been followed up by 10% rallies, Lee observed in the notes. From June to July and from September to November, the S&P traded flat before jumping 10% after a breakout in its respective trading range. According to Lee, the technical breakout in stocks does come with a favorable fundamental backdrop that will help drive the market higher.
Research Report Insight #3
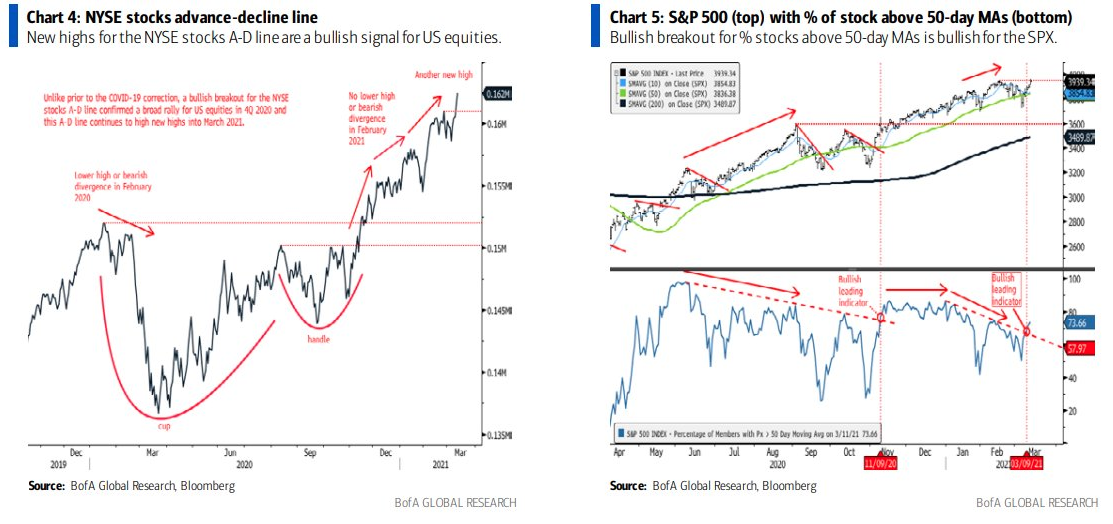
To further build upon the technical notes above, Bank of America offers their take on the NYSE and the more bullish breadth that formed this past week in the S&P 500, by way of the percentage of stocks trading above their 50-DMA:
Research Report Insight #4
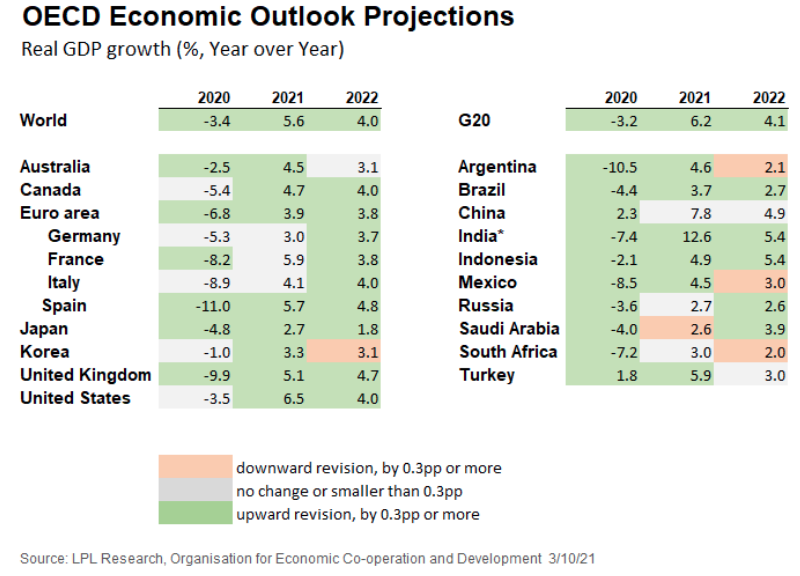
Week-after-week we continue to see positively revised economic growth expectations and forecasts. The Organization for Economic Co-operation and Development (OECD) increased its 2021 gross domestic product (GDP) growth forecast for the United States by more than 3 percentage points to a solid 6.5%. Growth in euro area GDP, which saw a much more modest increase (+0.3%) due to ongoing COVID-19 restrictions and slow vaccine distribution, is expected to fall short of 4%. China’s forecast was little changed at a very strong 7.8%, while India’s growth forecast, at over 12%, saw the largest increase.
Here are some more recent, domestic GDP forecasts offered this past week:
- From Merrill Lynch: We continue to track 5.5% for 1Q GDP. [Mar 12 estimate].
- From the NY Fed Nowcasting Report The New York Fed Staff Nowcast stands at 8.6% for 2021:Q1 and 4.0% for 2021:Q2. [Mar 12 estimate].
- From the Atlanta Fed: GDPNow The GDPNow model estimate for real GDP growth (seasonally adjusted annual rate) in the first quarter of 2021 is 8.4 percent on March 8, up from 8.3 percent on March 5. [Mar 8 estimate].
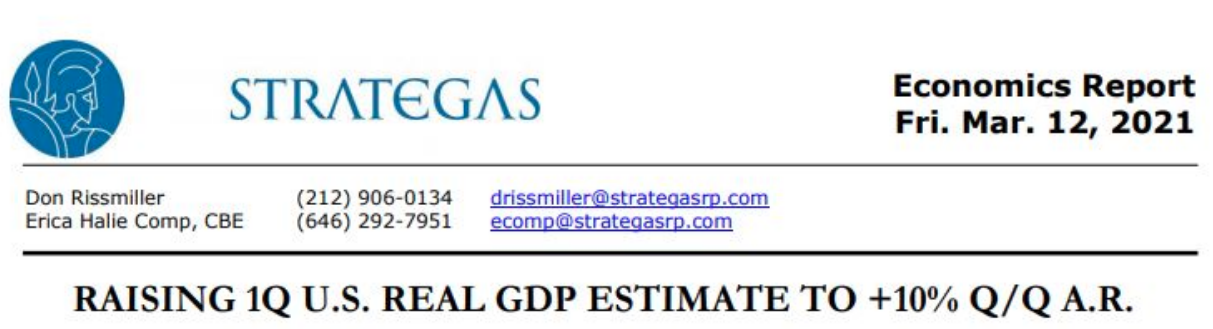
- From Strategas:
Research Report Insight #5
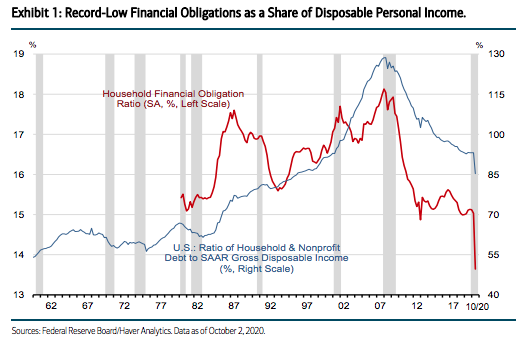
- Debt: In aggregate, U.S. consumers are over a decade into a deleveraging cycle that has brought the ratio of debt to disposable income back to levels last seen in the mid-1990s. Notably, leverage was falling without the fiscal stimulus payments. Looking to 2021, business cycle expansions typically include a household re-leveraging cycle.
Research Report Insight #6
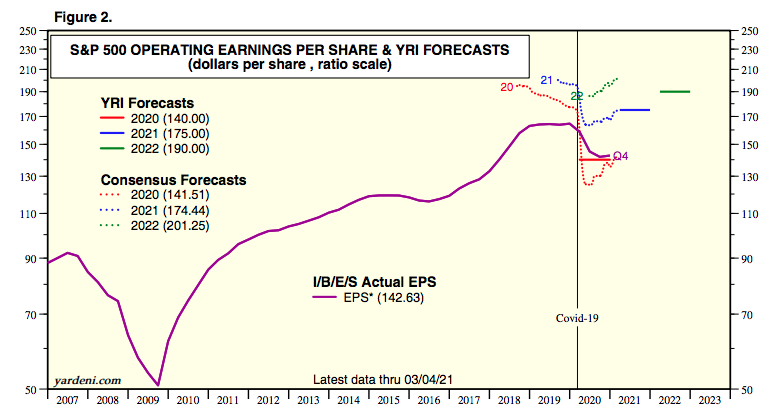
The latest, consensus analysts estimates for FY2021 EPS are as follows and nearly $6 per share higher than they were a mere 3 months ago:
While earnings drive the market's long-term, for the week ahead, both equities and bonds are likely to take their respective lead from the Fed. The central bank is expected to give a nod to much better growth when it meets this week and delivers its outlook on Wednesday. Bond pros are also watching to see whether Fed officials will tweak their interest rate outlook, which now does not include any rate hikes through 2023.
Research Report Insight #7
Furthermore, with RSI and Momentum identifying bearish momentum divergence, we might anticipate a MACD bearish crossover at these elevated levels near-term.
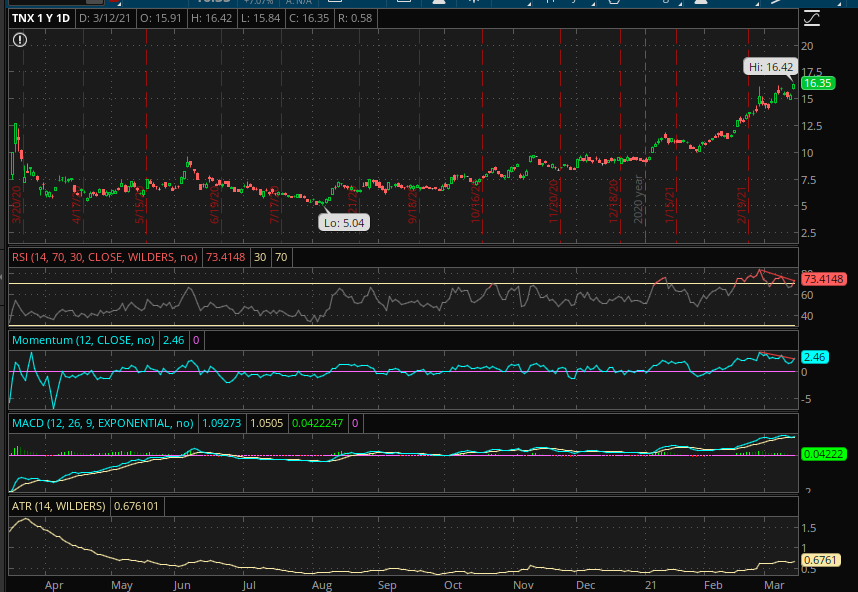
The ATR (Average Trading Range) in the bottom panel identifies the rate-of-change in TNX has been quite elevated since late February. This indicates the strength in TNX since, which is understood to be abnormal in the context of the 1-yr. chart and absent the 2020 period off to the left side of the chart.
Research Report Insight #8
I also realize there is probably no better time to market your firm’s research and no better way to do so than with this kind of headline:
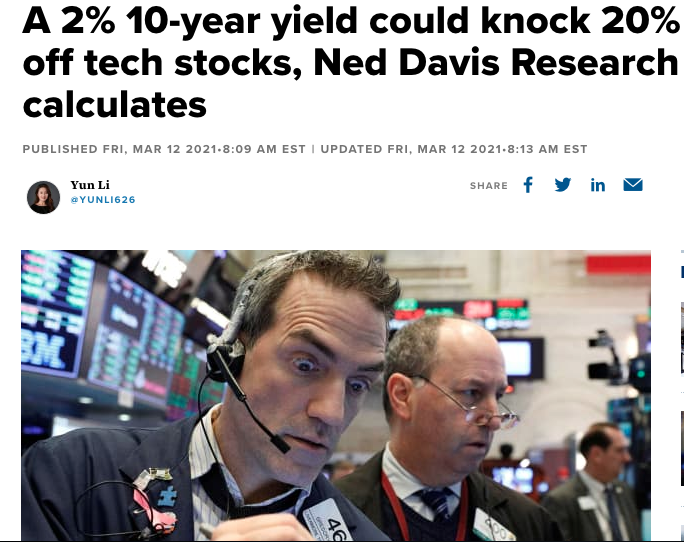
Many will read the headline and transplant “will” for “could”. It’s just the way investors see such headlines that are produced in order to drive fear and subsequent clicks. Nonetheless, “could” is not “will” and I would be of the opinion that Ned Davis Research would have no part in predictions and/or absolute titles for an article. There are legalities associated with such disseminations folks!
Research Report Insight #9
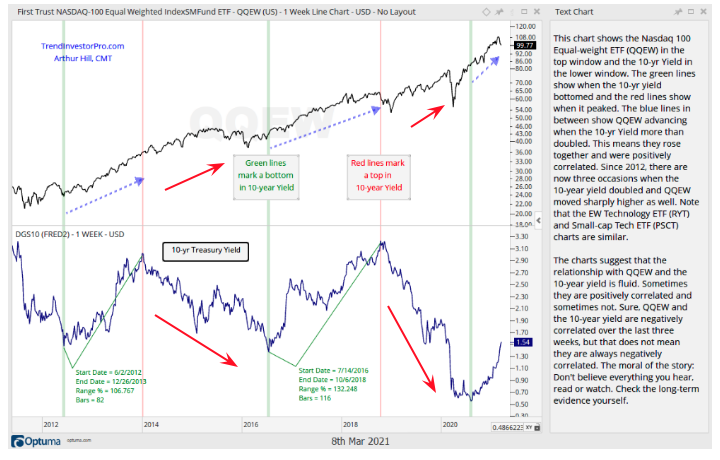
- The top panel is the equal weight QQQ/tech. In other words, it includes FANMAG and all the tech/consumer discretionary heavyweights but places them at the same weighting as the mid and small-cap names in the QQQ ETF.
- The bottom panel is the TNX/10-yr. yield. Notice anything?
- When the 10-yr. yield rises, QQQEW rises. When TNX dips, sometimes QQQEW does, but that depends on the magnitude of the dip.
- The red arrows in the chart above identify a continued rise in QQQEW even as TNX moves “lower for longer” periods. In other words, there’s not really a correlation; tech is rising most of the time regardless of what TNX is doing.
When we take the Ned Davis research and pair it with the chart analysis from Arthur Hill, what we can surmise is that this is more an issue of relative earnings growth that may have already been priced into FANMAG. If there is greater earnings strength potential to be realized elsewhere, that is simply where investors are flocking to, until that potential earnings growth is priced in and realized earnings growth is discovered.
Disclaimer: The risk of loss in stock, stock/options, futures, futures/options, and forex trading is substantial, and site visitors and subscribers should consider whether trading these markets ...
more

