
Bulls Pulling In Horns In Recent Weeks, But Sentiment Nowhere Near Dec Lows
Since early May, stocks have come under pressure. Investors sentiment similarly is on the back foot. But it will be a while before bullish sentiment reaches a washout low.
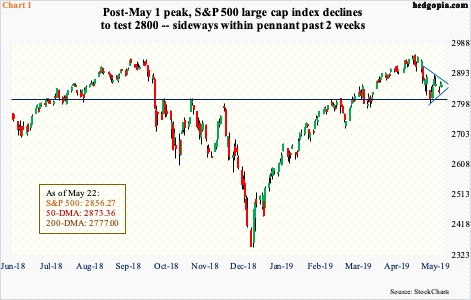
US stocks came under pressure as soon as May began. From the all-time high of 2954.13 on May 1 through 2801.43 on May 13, the S&P 500 large cap index dropped 5.2 percent, before bids showed up at 2800 (Chart 1). This has been an important price point for both bulls and bears going back to March last year.
Currently, the index (2856.27) is caught right between the 50- and 200-day moving averages, with the former having resisted rally attempt on Tuesday. The past two weeks, it is also in consolidation within a pennant, which tends to be a continuous pattern. Should a breakdown occur, 2800 once again will be where bulls and bears will lock horns. Bulls cannot afford to lose this support.
A loss of 2800 has the potential to further impact investor sentiment.
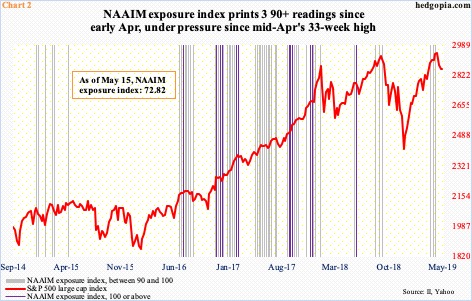
Sentiment in the past several weeks has been under pressure. The NAIIM (National Association of Active Investment Managers) exposure index, which measures members’ average exposure to US stocks, reached a 33-week high of 93.4 mid-April. A month later, this was down to 72.8 percent. (As of this writing, the May 22nd reading is yet to be published.)
The latest decline preceded three 90-plus readings. This was also the case when the S&P 500 peaked last October (Chart 2). Readings of 100 or above are very rare. A week before the S&P 500 bottomed last December, the exposure index dropped to 32. Thus, in a scenario in which the S&P 500 continues to unwind its weekly overbought condition, NAAIM members can continue to reduce exposure to stocks, which is how a durable bottom is reached.
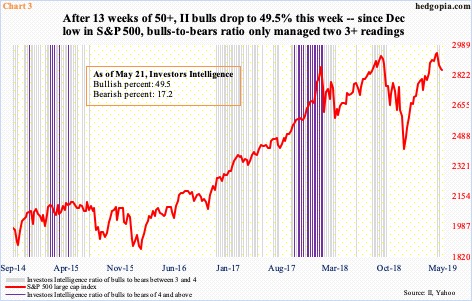
This is also the case with Investors Intelligence’s survey of newsletter writers. This week, bulls’ count dropped 1.9 percentage points week-over-week to 49.5 percent. This was the first sub-50 reading in 13 weeks. Prior to this, bulls reached as high as 56.4 percent at the end of April – right before stocks began to sell off.
Throughout the four-month rally since stocks bottomed late December, bulls acted relatively subdued. There were only two three-plus readings in the bulls-to-bears ratio (Chart 3). Contrast this with how effusive sentiment was leading to the selloff last October and in January even before that. Particularly in the latter, there were several four-plus readings. Not so this time around. Increasingly, bulls are getting less and less aggressive. That said, at just under 50 percent, their count is still respectable. As stocks were bottoming late December-early January, they fell to 29.9 percent early January. Bears were 34.6 percent back then, versus 17.2 percent this week – a 61-week low.


