
Bulls Cannot Afford Breach Of 2100+ On S&P 500 And 950-960 On Russell 2000
The announcement of QE4 last week failed to stabilize stocks. This is unlike how they behaved during QE1/2/3. Fear rules. Just a month ago, greed did. Sentiment will reverse. Last week, major U.S. equity indices were once again slammed. Even amidst this, the S&P 500 (SPY) seemed to want to stabilize, even as the Russell 2000 (IWM) defended the lows from February 2016. This cannot be breached. On the S&P 500, north of 2100 is key.
On the 15th this month, in an emergency meeting, the Fed announced it would purchase $500 billion in Treasuries and another $200 billion in mortgage-backed securities over coming months. It also cut the fed funds rate by 100 basis points to a range of zero to 25 basis points. This followed a 50-basis-point cut – also intra-meeting – on the 3rd.
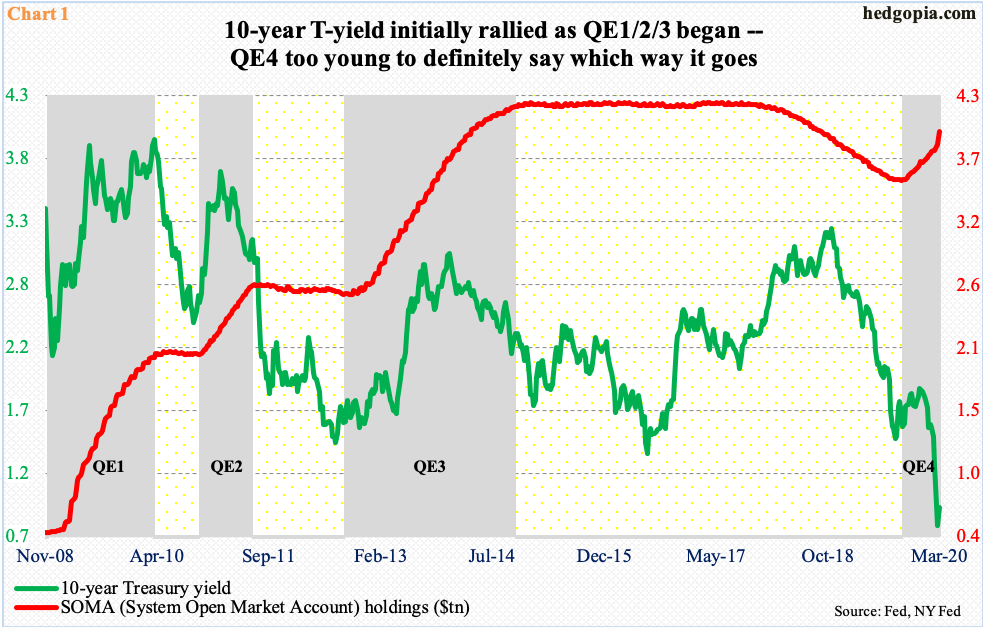
The central bank is pushing the stimulus pedal flat to the floor. It wants lower rates, among others. Reacting to the Fed move, the 10-year Treasury yield dropped 22 basis points last Monday to close at 0.73 percent. By Wednesday, however, rates had gone the other way, tagging 1.27 percent, before ending the week at 0.94 percent. (SPTL)
To be fair, during the three iterations of quantitative easing (QE) in the past, the 10-year did rally initially (Chart 1). This time around, the grey bar labeled as QE4 dates back to late September last year when the Fed began to aggressively purchase Treasury bills in order to deal with money-market stresses. It began to also buy Treasury notes and bonds only last week, with purchases of $111 billion in notes and bonds and none in bills. Last week, the 10-year fell one basis point, while the 30-year was flat – not quite an outcome the Fed probably wanted. After all, to “restore market functioning” was how Chair Jerome Powell described was one of the goals of the Fed’s stimulus efforts.
Thus far, equities have been much more rebellious. Last week, the S&P 500 large cap index crashed another 15 percent. Going back even further, the index closed at 3090.23 on the 2nd, just prior to the emergency 50-basis-point cut. Friday, it closed at 2304.92.
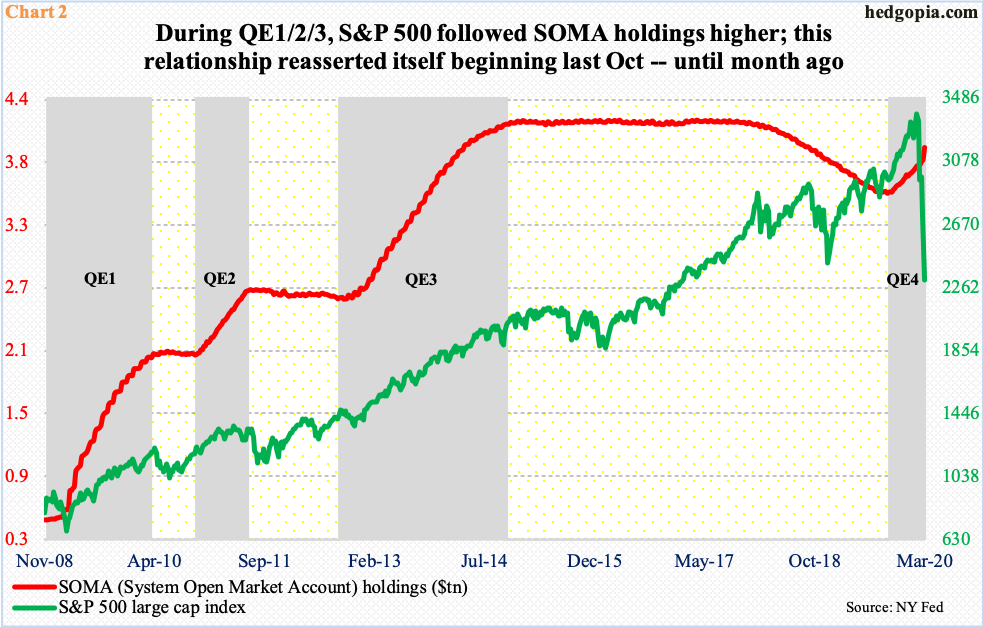
This is quite uncharacteristic of how stocks behaved during the prior three iterations of QE (Chart 2). Back then, stocks followed QE higher. The Fed would like this relationship to reestablish, so investors begin to not only take on risk but also go up the risk curve. The ‘wealth effect’ then can reverberate through the economy in a positive way. It has not happened.
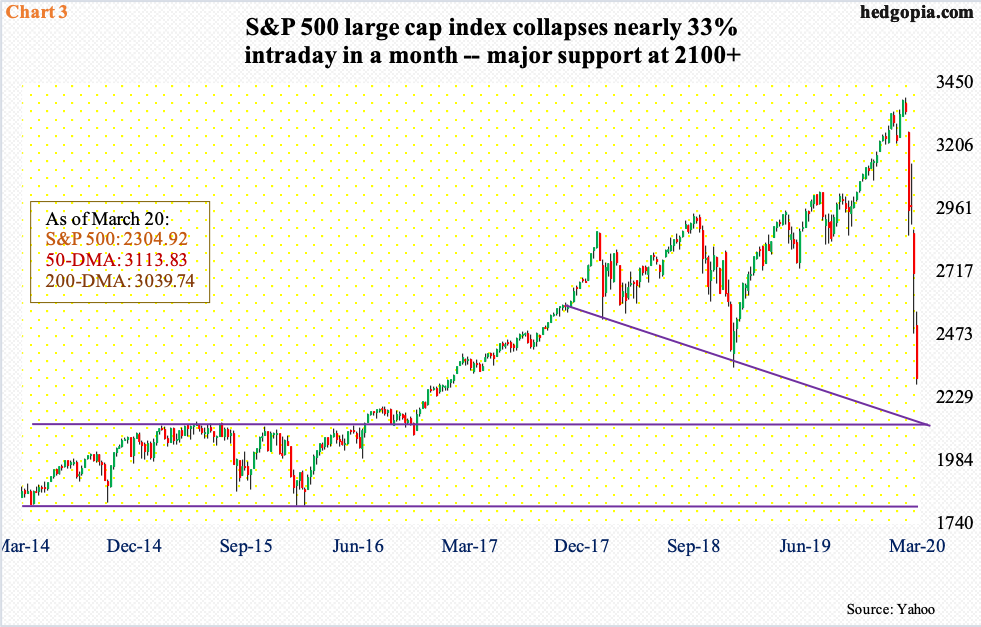
Since peaking on February 19 at 3393.52 through last Wednesday’s low of 2280.52, the S&P 500 collapsed nearly 33 percent. The opening of the monetary spigot has brought no relief.
Last Wednesday, it undercut the December 2018 low by nearly three percent before bids started showing up, resulting in a candle with a long lower wick. This was followed by a daily spinning top Thursday. Come Friday, selling continued, down 4.3 percent. In the overnight futures market, rally attempts were repeatedly sold near 2500.
Despite last week’s massive drop, the daily chart looked to be wanting to go sideways – a must in the current environment. At the time of this writing, futures were once again down in the four percent range. There is major support just north of 2100 (Chart 3). If bulls cannot put their foot down here, bears could be eyeing 1800-1900.
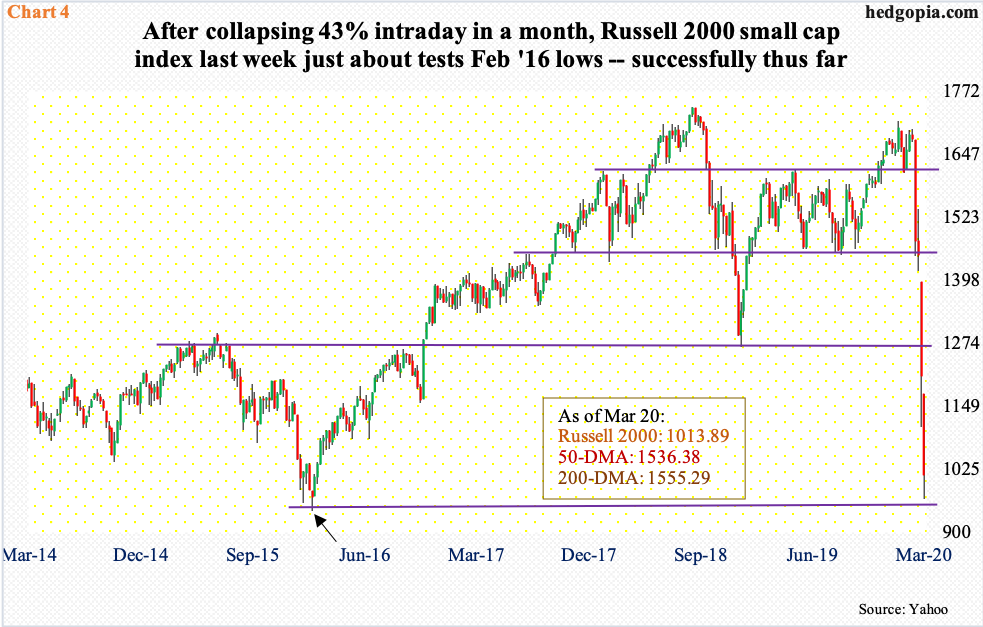
On the Russell 2000 small cap index, a major bottom was formed in February 2016 at 943.10 intraday (arrow in Chart 4). The rally that followed ended in August 2018 when it peaked at 1742.09. Small-caps peaked much earlier than their large-cap peers. This was a major divergence.
Both Thursday and Friday last week, the Russell 2000 dropped to 960s intraday before bids started showing up. It closed the week at 1013.89. By then, however, in a true ‘staircase up elevator down’ fashion, the index tumbled 44.5 percent from its record high and over 43 percent just from February 20th.
Continued holding of the February 2016 low will go a long way in stabilizing investor sentiment, which obviously has taken a big hit.
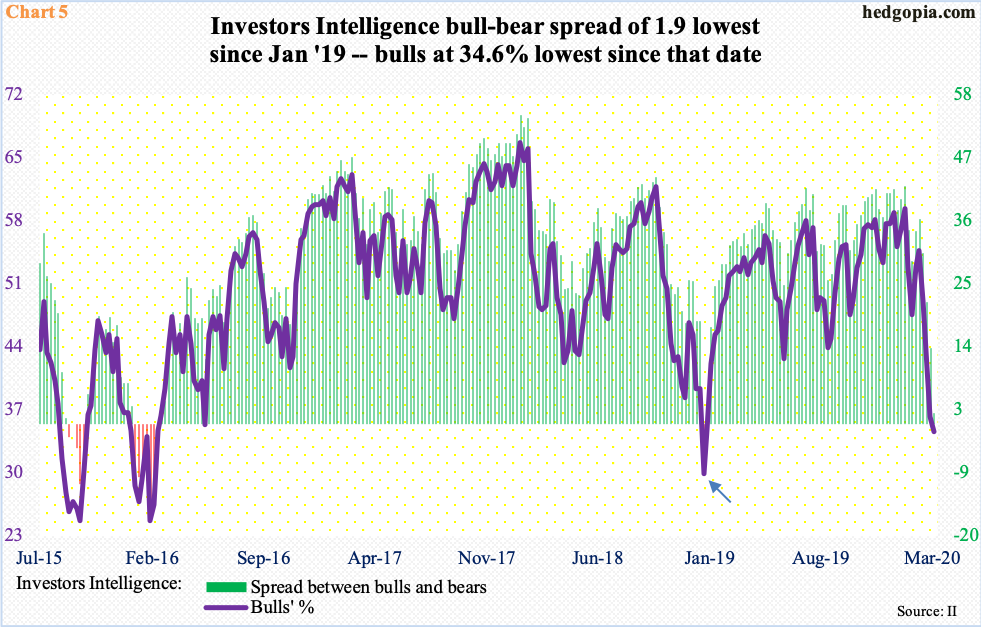
In the third week of January, Investors Intelligence bulls were 59.4 percent, which was the highest reading since October 2018. Back then, stocks then entered a three-month selling phase. This time around, from the January high through last week, sentiment tumbled 24.8 percentage points to 34.6 percent, which was the lowest since 29.9 percent in the first week of January last year. That turned out to be a major bottom for U.S. stocks.
Bears were 32.7 percent last week, versus 34.6 percent in January last year. As a result, the bull-bear spread was a positive 1.9 percentage points – not quite a washout territory similar to what was seen in January last year but getting close (arrow in Chart 5). This week’s reading will be telling.
Other sentiment metrics are beginning to show more panic.
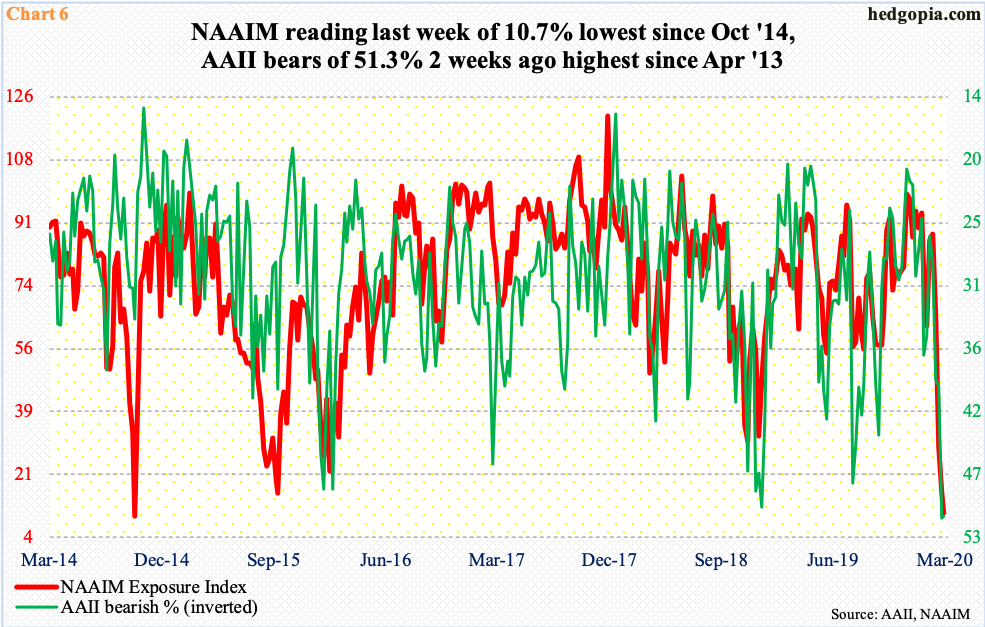
The NAAIM Exposure Index, which represents National Association of Active Investment Managers members’ average exposure to U.S. equity markets, fell to 10.7 last week. This was the lowest since October 2014. As early as the third week of January, the index was 93.8. Quite an unwinding!
Elsewhere, American Association of Individual Investors bears were 51.2 percent last week, down slightly from 51.3 percent the week before, which was the highest since April 2013 (Chart 6). In due course, this will unwind. It is a matter of when, not if. The issue at hand is accelerating downward momentum in stocks, no matter how oversold they are. Fear rules. Mid-February, greed did.
In this regard, what transpires north of 2100 on the S&P 500 and in the 950-960 area on the Russell 2000 is key.


