
Bulls, Bears Remain Locked In Range-Bound Action, Even As Options Signal Froth Building
Range-bound action continues on major US equity indices. After defense of support last Thursday, they gapped up Mon to rally right into resistance. No breakout yet. This is taking place in the wake of massive rallies off of the March lows and even as indicators such as the CBOE equity-only put-to-call ratio once again are nearing frothy levels.
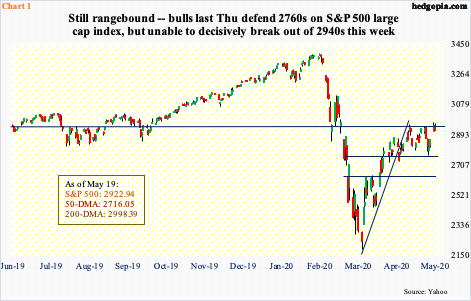
Last Thursday, bears had an opening to push prices lower, but bulls denied them that opportunity stepping up in defense of support. On the S&P 500 large-cap index, 2760s was saved. This also approximated the daily lower Bollinger band. Monday, it gapped up to test the upper bound. In the first two sessions this week, 2960s was tagged in both, but the index Tuesday struggled to stay above 2940s (Chart 1).
In other words, traders continue to play ping pong. Amidst this back-and-forth, from bulls’ perspective, the good thing is that the index (2922.94) remains above 2850s-70s.
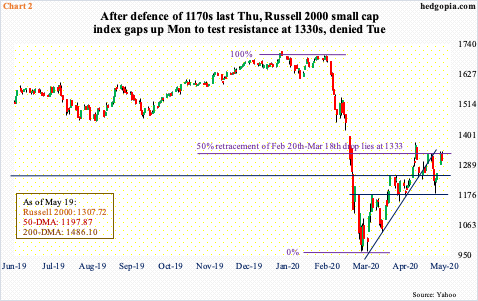
This is also the case with the Russell 2000 small cap index (1307.72), which remains above 1250s. Bulls lost this level last Wednesday but repaired the damage quickly by saving 1170s in the very next session (Chart 2). Monday’s gap-up reclaimed 1250s before testing 1330s – again. At 1333 lies 50-percent retracement of the February-March collapse. This level has been a roadblock for three trading weeks now. This is yet to fall.
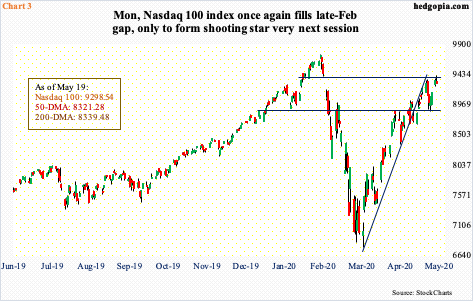
Similarly, on the Nasdaq 100 index (9298.54), the bull-bear duel continues. Bulls defended 8900 last Thursday, followed by a gap-up Monday into gap-down resistance from late February (Chart 3). At 9400, the gap got filled. Bears have been active around here. Tuesday’s intraday high of 9422.90 also tagged the daily upper Bollinger band but only to end the session down 0.4 percent for a shooting star session. This follows a weekly long-legged last week.
All these three equity indices, and several others, have rallied massively from the March lows, pushing several indicators into extended territory. Monday, 95 percent of Nasdaq 100 stocks were above the 50-day. In the middle of March, this was two percent.
Greed has rapidly replaced fear. This is evident in the options market.
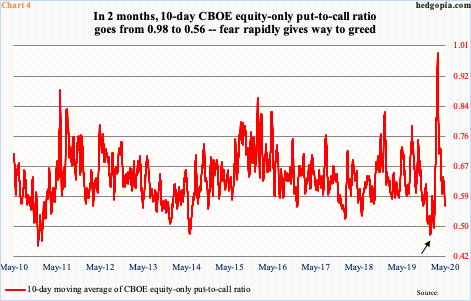
Tuesday, the CBOE equity-only put-to-call ratio printed 0.46. This came on the heels of a 0.47 reading on Monday. The 10-day moving average read 0.568 on Tuesday. This is the lowest since February 25th. Earlier on the 19th that month, it dropped as low as 0.501 and 0.48 on January 17th (arrow in Chart 4). Equity bulls are hoping things get as frothy, or frothier. For this scenario to come to pass, the aforementioned resistance levels – 2940s on S&P 500, 9400 on Nasdaq 100 and 1330s on Russell 2000 – need to decisively break. This likely also causes short squeeze, as non-commercials are heavily net short e-mini S&P 500 futures in particular (chart here).
At the same time, once stops get taken out and shorts are squeezed, it will be a no-brainer shorting opportunity. As a matter of fact, if the past is prelude, the red line in Chart 4 has tended to reverse higher from low- to mid-0.50s. The current reading already is extended.


