
Bulls, Bears & Market Timers Square-Off: What You Get From Froth
U.S. equity markets were little changed on Tuesday and after the S&P 500 hit yet another record high at 3,085 intraday. The S&P 500 has hit a new record high each November trading day thus far, which just happens to be the top month of the year for the record high achievements in the benchmark index.
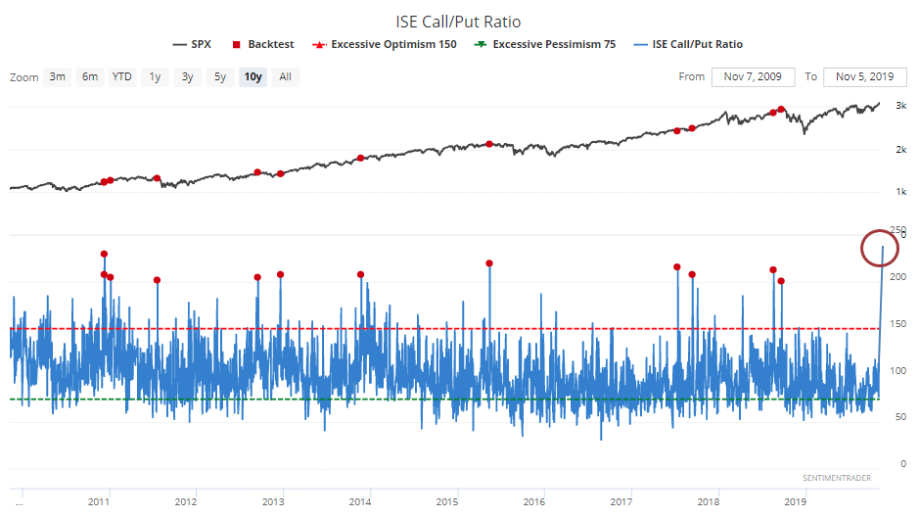
The market has been climbing a wall of worry all year long and doing so with rather a poor investor sentiment. But of late and with the S&P 500 having entered the best 6 months to own stocks, it seems as though the bearish market sentiment has shifted in favor of bullish sentiment. At least that is what we can glean from certain investor activity and/or positioning of late. Options traders on the ISE exchange bought 238 calls for every 100 puts on Tuesday. That's the most since December 2005. The last time they bought more than 2 calls for every 1 put was in September. It hasn't happened too many times over the past decade.
A good many positives have aligned as of late, almost forcing investors to reverse course, lower cash levels and buy stocks/ETFs. Barclays outlined their characterization of the markets Climbing the Wall of Worry as follows:
- We expect equities to remain supported into the year-end as the macro regime is turning more constructive: trade and no-deal Brexit tail-risks are receding, activity momentum and bond yields are stabilizing, central banks are put.
- Light equity positioning compared to crowded safety trades suggests the pain trade is still on the upside.
- A mild recovery seems more likely than a recession in 2020
- We find Europe and EM exposure offering an increasingly attractive tactical risk-reward vs. the US.
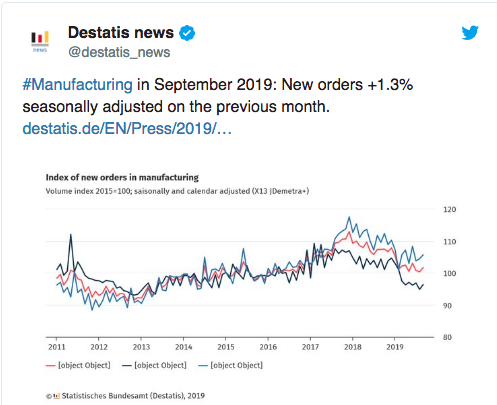
Speaking of Europe and/or the Eurozone economy, factory orders in Germany, Europe’s biggest economy, increased in September after two consecutive monthly declines.
The Economy Ministry said Wednesday that orders were up 1.3% compared with the previous month. They were led higher by demand from countries outside the eurozone, which was up 3%, and domestic orders, which rose 1.6 percent. Orders from other countries in the 28-nation eurozone dropped 1.8 percent.
But reverting to our bullish sentiment for U.S. stocks conversation, Nomura's quant team recently offered that "The market's expectations for a US-China trade agreement are becoming stronger with each passing day, and many investors seem to have come to the conclusion that they have no choice but to take on more risk."
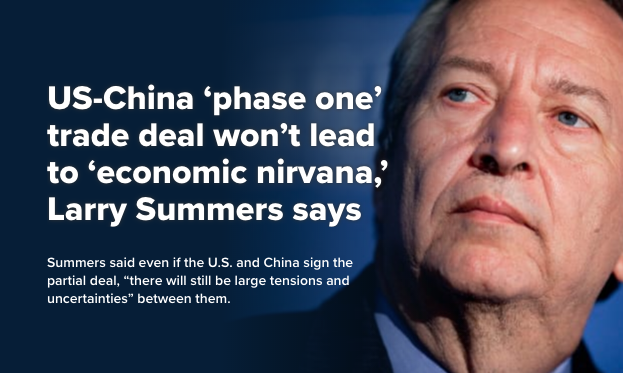
While most investors believe a U.S.-China trade deal to be a major win for the domestic and global economy, not everyone is of the same opinion. former U.S. Treasury Secretary Larry Summers warns: “I think we’ll be kidding ourselves if we thought we were one signing ceremony away from some kind of economic nirvana. There are deeper and larger issues that are holding back rapid global expansion.”
Mike Wilson of Morgan Stanley has also suggested a trade deal of sorts wouldn't fix what ails the markets, despite his year-long drought of market forecasting. Wilson has moved from one issue to the next regarding the market's reaction to economic data and earnings in 2019. His price target for the S&P 500 in 2019 was never revised higher when the calendar year flipped from 2019 to 2019. His 2018 target of 2,750 still remains the base case but had been forced to at least offer an outsiders bullish upside possibility of 3,000. Wilson's lack of touchpoints with the market and consistent negation of historic statistical data pointing to why the market probabilities aligned with multiple expansion, have failed to find most any of his forecasts come to fruition in 2019. There's a good deal of recency bias (S&P 500 rolling bear market of 2018) that has plagued Wilson's economic and market sentiment in 2019.
In Wilson's latest rant only a couple of weeks ago, on CNBC, he went so far as to call for an economic recession. I don't know how much more concerning it would get from a failed analysts' forecast to take the leap and basically throw everything but the kitchen sink at one's analytics than to say "we need a recession". Nonetheless, that is exactly what Wilson did in the last week of November when he said the following:
"The economy isn’t as strong as the stock market suggests, and a recession would help “flush” out those misplaced expectations. I’m rooting for a recession in some ways because that’s what would get the flush in terms of expectations that still has to happen. And then we can have a cyclical recovery.”
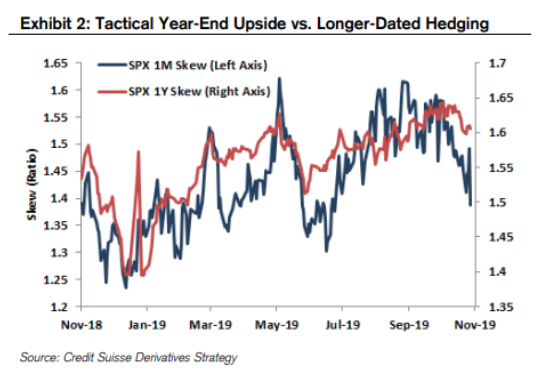
Investors have largely ignored the poster child for the 2018 rolling bear market, here in 2019. Wilson rose to become a CNBC--analyst darling in 2018 and still frequents the channels programming on a regular basis, but investors have lost faith in his analysis. While Wilson is calling for a recession, economic data has seemingly bottomed and investors have been chasing bullish options, pushing skew down. Even so, longer-dated skew remains more elevated as investors hedge for the longer-term.
The bullish activity in the S&P 500 as of late has brought about some optimism not seen a while. CNN's Fear & Greed index has recently been pushed to extremes, beyond 80. But is this enough to suggest investors should be sellers at this level of optimism or "Greed"? I often suggest that if the macro-fundamentals haven't weakened and S&P 500 EPS is expected to grow going forward, that when market conditions are found "euphoric", that's a better time to add on dips, as timing tops is a poor discipline for selling purposes. Most market timers will sell too soon as overbought conditions can last longer than most think or project. After selling too soon, what tends to happen is that when the dip/pullback does come, those same market timers buy back stocks too soon. Don't be that guy/gal! Longer-term thinking, even in the active portfolio management paradigm, is an easier trader/investor psychology to manage and/or express.
Moreover, an example of why simply buying dips over selling rips is a better idea when correlated to the CNN Fear & Greed index extreme readings comes by way of the Sentiment Trader's latest chart study.
"We calculate a proxy model with one slightly different input in order to generate more history. It, too, just climbed above 80. Not enough for a sell signal."
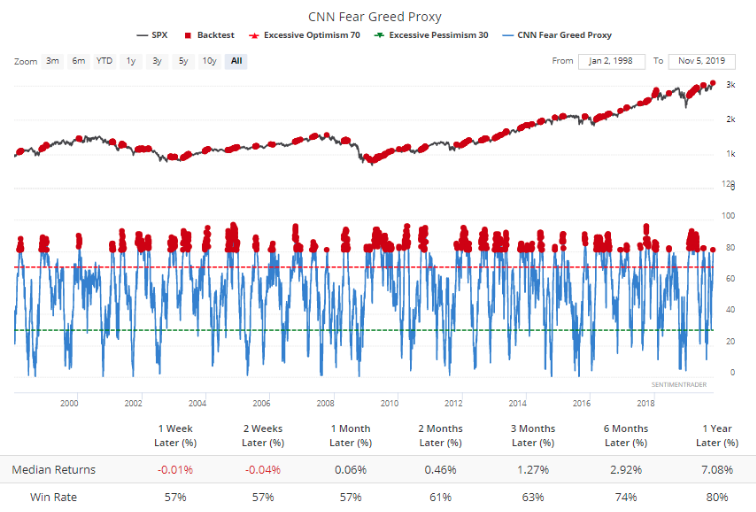
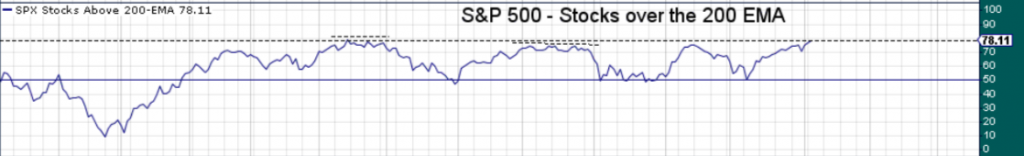
Based on the study, even and across most time frames out a year, the market still offers positive returns after the Fear & Greed index achieves 80 or better. Again, this doesn't discount a near-term pullback in the market, but rather generates the probabilities for market returns going forward. Nonetheless, it is getting a bit frothy for equities. We can see this in certain of our breadth indicators heading into Wednesday's trading session. The number of stocks trading over their 200 EMA reached 78%, generally where we've seen a top in the market and as shown in the chart below.
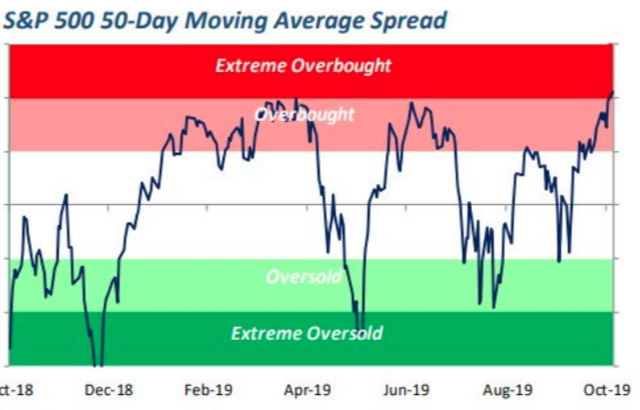
One of the more simplistic charts suggesting the market is way overbought is the S&P 500 50-DMA chart. As shown in the Bespoke Investment Group 50-DMA chart, the S&P 500 is now the most overbought it has been in the last 12 months.
We can make the argument for overbought conditions all day folks, but here's the thing; markets have just broken out from a long-term consolidation period. There has been a great deal of pessimism expressed over an extended period of time, which has served to sustain a rangebound market. (Chart from Chris Ciovacco)
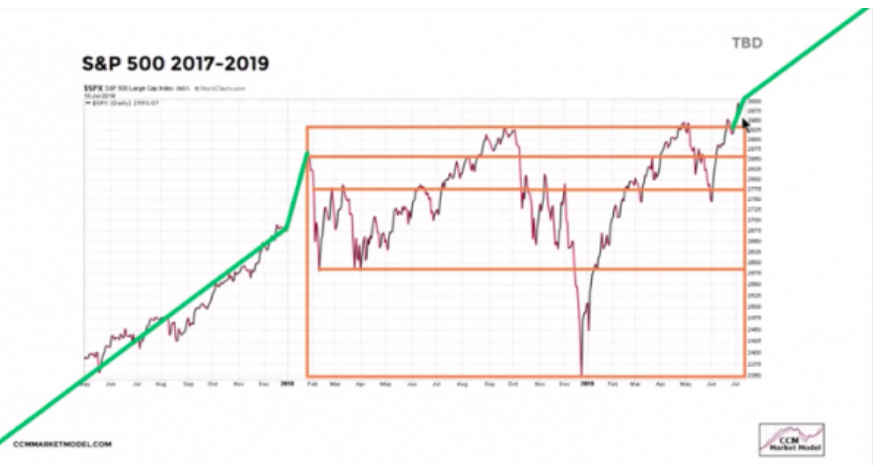
What happens when pessimism, from macro and geopolitical issues, it turns to optimism with the potential for earnings growth in the mid-single digits going forward, is the production of the next market leg higher. So while the bears are stomping their feet and laying claim to a future pullback, which is almost inevitable, those same bears might look to lighten their bearish positioning. Such activity is only fuel for the markets and a continuation of the market rally.
In speaking of one such bearish market call, we take a look at the latest blog from market pundit, trader and newsletter writer Samantha LaDuc.
LaDuc's latest narrative on the market is just her latest bearish call, as she is found typically critical of markets and the economy. Like most permabears, they underperform the market's benchmark return over time and hold high cash reserves while laying claims to positive performance, somehow, some way. It's hard to outperform with high cash levels, but somehow...
BoAML's proprietary Cash Rule Indicator has been in bullish territory for the last 20 months. Fund managers polled in the bank’s latest survey said they are holding an average of 5% of their portfolios in cash. That compares with a 10-year average of 4.6 percent. And UBS Global Wealth Management survey of 4,600 wealthy entrepreneurs & investors offers that cash holdings rose a percentage point to 27% of survey respondents’ portfolios at the end of the third quarter from the previous quarter.
But referring to Samantha LaDuc's bearish outlook and speculative cash position let's take a look at why she is less than optimistic about future market returns.
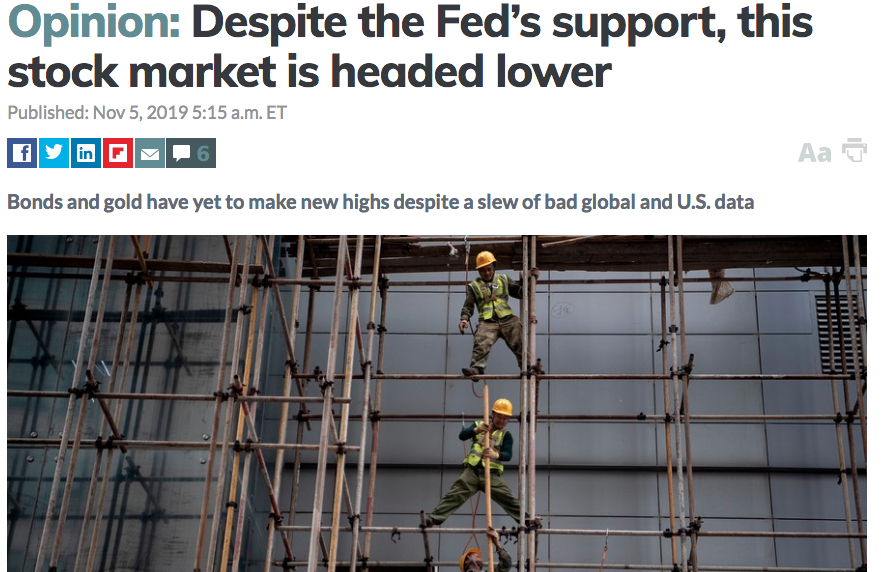
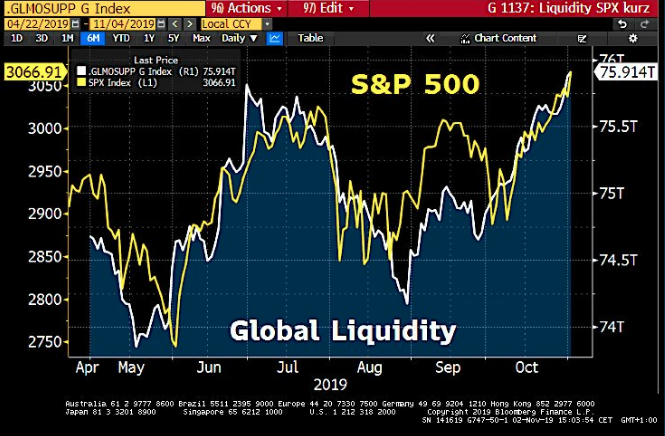
"Clearly the bond market is not convinced of Powell’s assessment of the stability in the economy in general and in the repo market in particular. The Fed would need to cut rates significantly to eliminate the rate differential or “spread” between domestic fed funds and the effective negative cost of funds offshore. Its liquidity injections aren’t enough, especially as the money leaks out into the offshore dollar funding market."
While LaDuc makes a good point, liquidity is relevant and central banks play a key role in providing liquidity for financial markets, she thinks the interconnectedness of central banks is lost on her, even if we can obviously prove cynical of the FOMC's efficacy. The FOMC is no less acting in accordance with all normal operating procedures than it is working under the paradigm of an interconnected central banking system and global economy. So while we can talk "repo" all day and every day
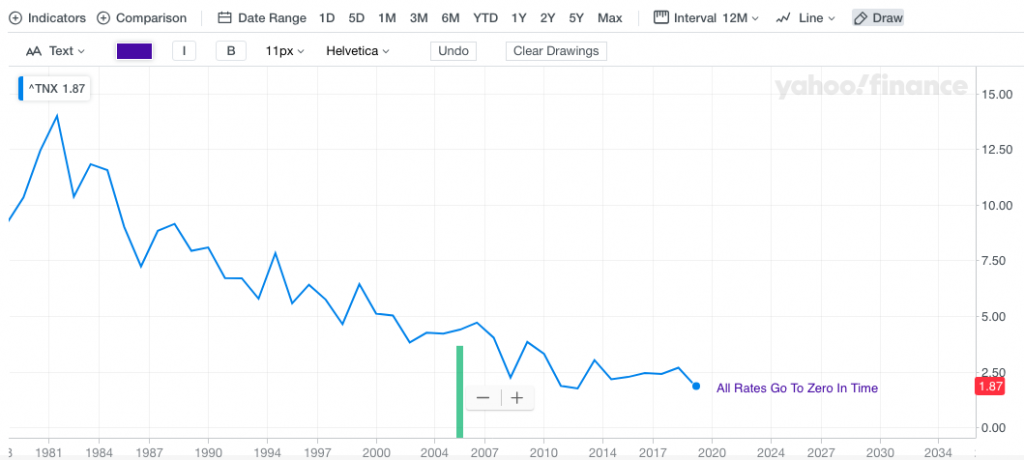
Moreover, LaDuc goes on to discuss the Fed's hawkish hold on rates that implies dovish intentions in the future. "Instead, America’s fiscal policy will drive interest rates up as we are now left to finance our deficits ourselves, she says. Ummmm, remember the last time the world didn't finance the U.S. deficit? Remember the time there was a lack of appetite for U.S. debt. Something tells me LaDuc is/has been and will be ignoring the longstanding trajectory of rates. All rates go to zero folks, it's just a matter of when. If they didn't, what would Jeffrey Gundlach do with his infamously underperforming bond funds. (Underperformance to 20yr SPX returns)
The chart of the 10-year yield is in conflict with most equity market bears and lays waste to those whom have ever claimed the U.S. will have a hard time funding its own deficit. Even, yes even at the expense of FOMC policy. Can we get a bounce in yields/rates; of course. More than that, the chart is laughing folks, the chart is laughing!
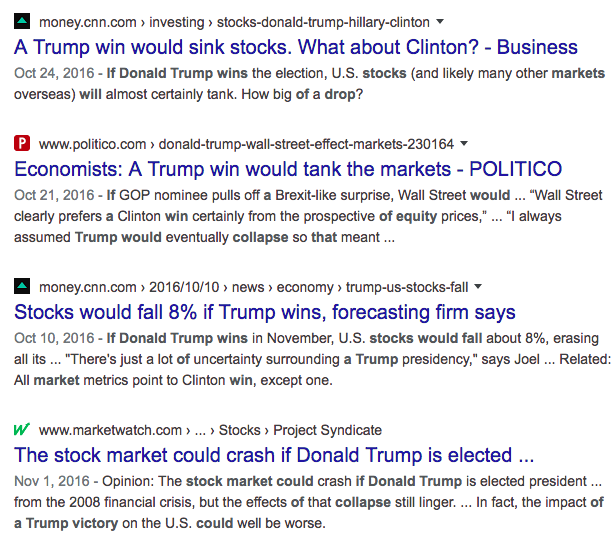
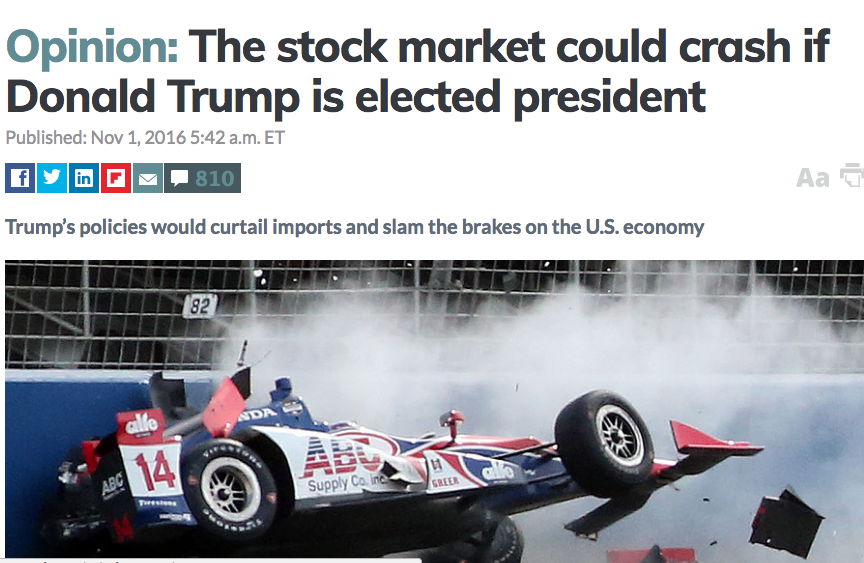
LaDuc is of the opinion that higher yields and lower equity prices/markets are on the way. She paints the portrait of markets collapsing in Mid-November under the weight of a global economic slowdown that further erodes future earnings growth potential while reducing corporate buyback activity. She's also building the case that the current Trump impeachment inquiry may fuel an Elizabeth Warren election win? And we've all seen the fanciful narratives thrown about by the partisan fund managers and billionaires lately. Seems as though LaDuc is just attaching her waning star to those same pundits calling for a precipitous market decline if Warren is elected. Haven't we seen this before or is this simply the evidence one needs to validate how off base these newsletter writers and media pundits and even fund managers often are when they lend their voice to domestic politics?
Do you recall, these same market calls were offered when President Trump became the Republican parties candidate for the presidency.
Need we really carry forward with all these variables that LaDuc is aiming toward a market decline into year-end. Here's the call:
"...lower prices starting in mid-November through the end of the year. I consider current price action around this level to be “cruising altitude” before it gets a little bumpy again. But in the prediction and investment game, we can be right but have the timing wrong.
I suspect bonds are about to roll over, structurally force yields to pop, then oil spikes with reflation trades, while momentum stocks are sold off because they’re overvalued relative to value plays …and the result is the stock markets correct.
The global carry trade, otherwise known as the bond bull market of 2019, will be tested before it is proven, but I expect this move could be quicker than folks think as liquidity is “challenged” when bonds sell off and volatility in the bond market spills over into equities. As a result, I see the asymmetrical rewards of playing this game of trading to benefit those who are either positioned short soon or have the patience to wait for the reset, which could be about 30% lower once we turn.
If you were looking for much of what Danielle DiMartino has been touting for the last 5 years, well there you have it folks, but through the veil of Samantha LaDuc. One would think a 5-year failed outlook from DiMartino and the permabear punditry might not be an outlook at all, but persistence and patience of the inevitable. In other words, a pullback, a recession, a bear market is inevitable, but market timing calls... if you want to have the poorest of market disciplines, look no further!
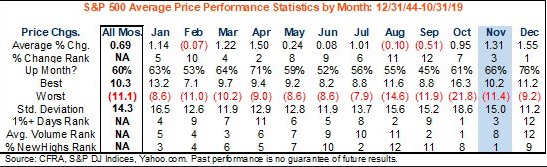
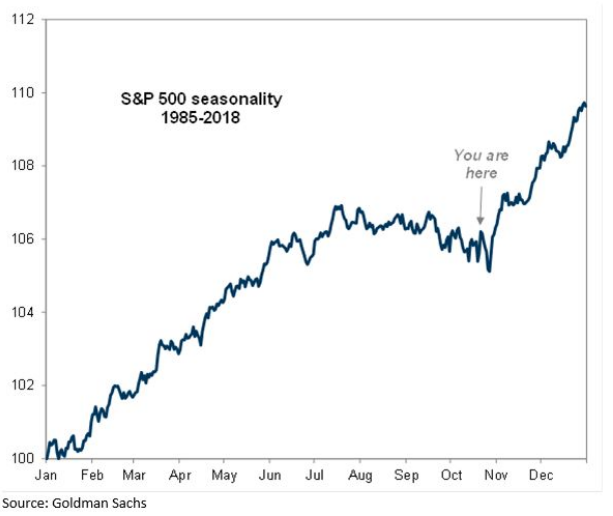
With that said the fact of the matter is that most November's are found with a seasonal impairment of a bullish trend. Why? When do you think hedge fund and portfolio managers achieve their redemption letters from their clients? Hedge fund clients have until November 15th to notify their fund manager of any redemptions desired. As such, the fund manager must ensure a level of cash reserves to satisfy forecasted redemptions. If they don't have the appropriate cash-on-hand, they sell assets, equities, ETFs and whatever in order to raise cash. It's why the seasonality chart looks as it does historically
And so with market conditions proving frothy and potentially on the verge of a naturally occurring distribution phase, investors might find themselves pulling out that "shopping list". Canaccord Genuity's chief market strategist Tony Dwyer is also of the opinion a market pullback is afoot and believes investors should buy that pullback.
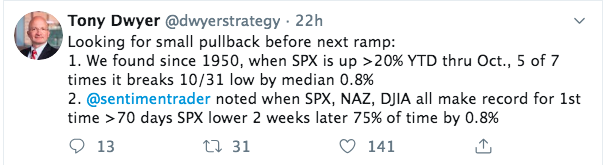
If .80 percent is the median pullback based on historic data and given the aforementioned market set-up, it is going to take a good deal more to elicit a drawdown through year's end. And don't get me wrong, "a good deal wrong" could easily be accomplished with a negative outcome from trade, but the probabilities of a negative trade headline have moderated lower over the last month.


