
Bullish Breadth & Squeezing VIX: Weekly Nifty 9
Welcome to another trading week!! In appreciation of all of our daily readers of finomgroup.com content, we offer the following excerpts from our Weekly Research Report. Our weekly report is extremely detailed and has proven to help guide investors and traders during all types of market conditions with thoughtful insights and analysis, graphs, studies, and historical data/analogs.
Research Report Insight #1
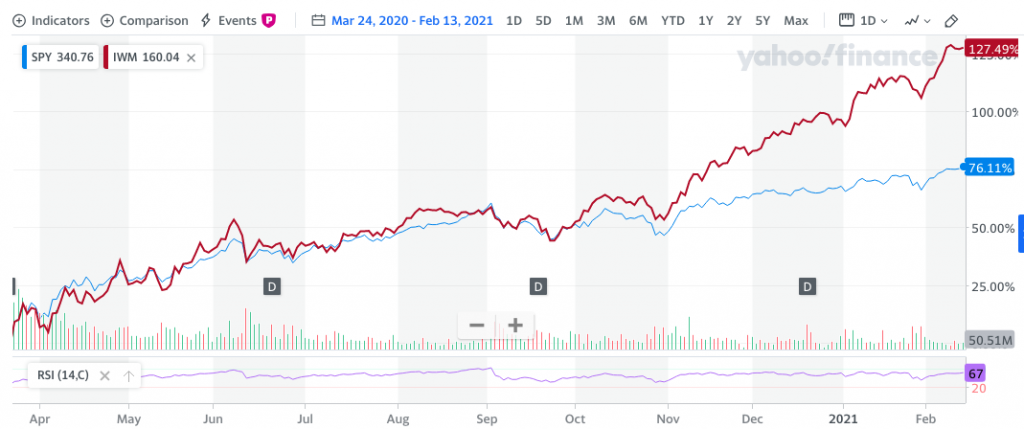
While the S&P 500 index ETF (SPY) is up a robust 76% since the March 2020 lows, the Russell 200 index ETF (IWM) is up more than 127% over the same period. There is a lot of like-minded positioning in the market presently that points to economic recovery, earnings recovery, and growing risk-on appetite. Additionally, don’t miss the point that small caps leading the cyclical recovery validates the new cyclical bull market, which may prove easy to overlook based on the outsized performance of the IWM. Lastly, don’t assume the outperformance of small caps is over, but rather look for the opportunity to ride the next leg higher should a pullback present itself near-term.
Research Report Insight #2
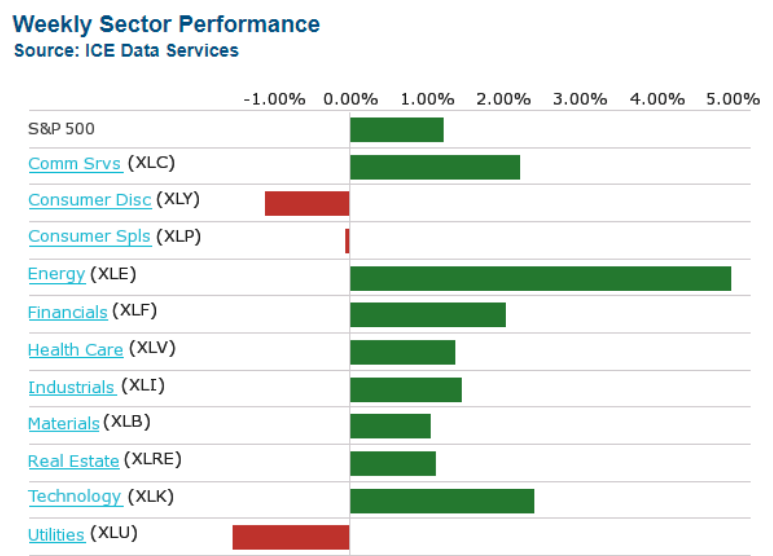
As has been the trend, the cyclical/reopening trade continued this past week with most defensive sectors finishing in the red while the growth and cyclical sectors charged higher. This trend has been validating the new bull market for months now and has proven investor-friendly. As it pertains to the Consumer Staples sector ETF…
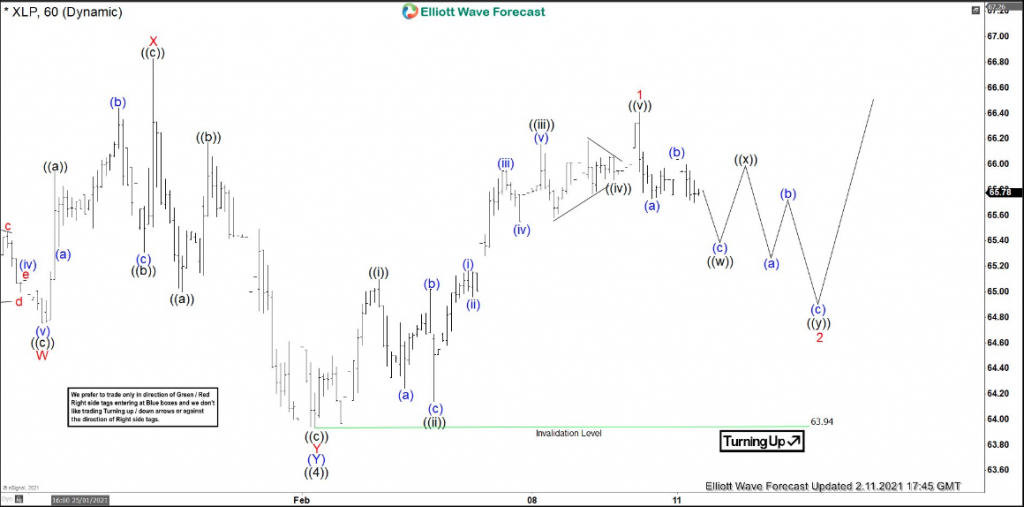
The Elliott Wave Forecast (A, B, C model) projects some more downside for XLP. It remains favored to extend higher, long-term, while above 63.94 low. Currently, a pullback to correct the January 2021 low is in progress, but as long as it remains above the noted level, the technicals suggest accumulation and higher prices in the future. In the coming week, Wal-Mart (WMT) will report Q4 2020 results. Wal-Mart is one of the more heavily weighted stocks within the XLP
Research Report Insight #3
Firstly though, from the former chart in last weekend’s Research Report, here is what the Value Line Geometric Index has done since:
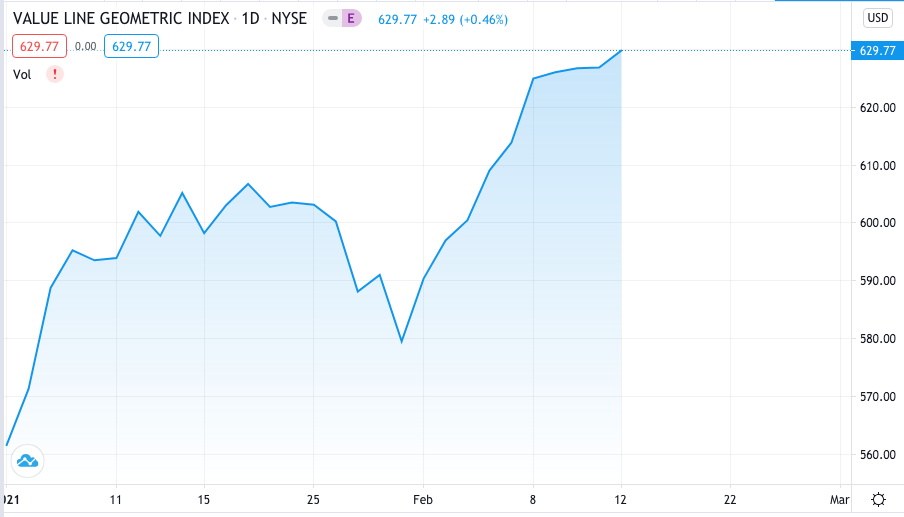
That chart shows a 9-trading day rally. This is actually more common than you might think. Therefore, what better way to align our understanding for potential S&P 500 returns than with something that just happened. (See study below) It’s probably as good a time as any to recognize that one of the best features of quantitative studies, such as these, is the exoneration of emotion and personal bias. Historic data shows us that despite our bias, our experience, our confidence levels, or the unique set of circumstances surrounding the market; human behavior is rather constant!
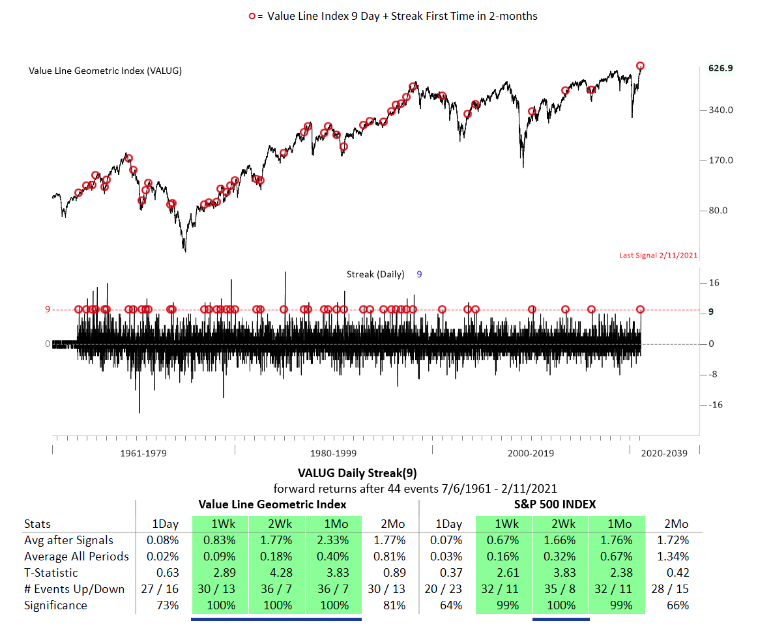
This particular study based on a 9-day win streak in the VALUG has happened 44 times in the past and has produced reasonable gains with a near 100% positivity rate going out one month. The average one-week forward return for the S&P 500, using this signal, would likely find the benchmark index achieving 4,000 this coming week.
Research Report Insight #4
According to FactSet, the blended earnings growth rate for the fourth quarter is 2.9% today, compared to an earnings growth rate of 1.8% last week and a year-over-year earnings decline of -9.3% at the end of the fourth quarter.
Insight/2021/02.2021/02.12.2021_EI/S%26P%20500%20Earnings%20Growth%20Q4%202020.png?width=920&name=S%26P%20500%20Earnings%20Growth%20Q4%202020.png)
Research Report Insight #5
So let’s quickly reiterate our 2021 Outlook, which was outlined in our January 3, 2021, Research Report as follows:
With that said, the official price target established for the 2021 S&P 500, from Finom Group, is 4,325. We have modeled for $182 in 2021 EPS, above the consensus analysts’ estimate, as we believe the street has not fully discounted that which they’ve not seen before, including how global trade partners might respond to a more amicable U.S. Administration after 4 years of de-globalization efforts. We also believe, barring an exogenous global event, Finom Group’s above-consensus estimate may prove too low should the tailwinds from a Service sector rebound build momentum in the back half of the year that produces nirvana-like economic conditions.“
As I have also said in the more recent past, our EPS estimate may prove too low if such nirvana-like conditions prevail. By the way, this Outlook was before the, now being considered 3rd economic relief package, dissemination by the White House Administration. While $182 in FY2021 EPS was above all Wall Street estimates, alongside our FY2020 $140+ forecast, we have begun to witness that our initial analysis was more in line with the probabilities than it was “pie in the sky”. The latest consensus EPS estimates for FY2020 and FY2021 have all been moving higher through the Q4 2020 earnings season.
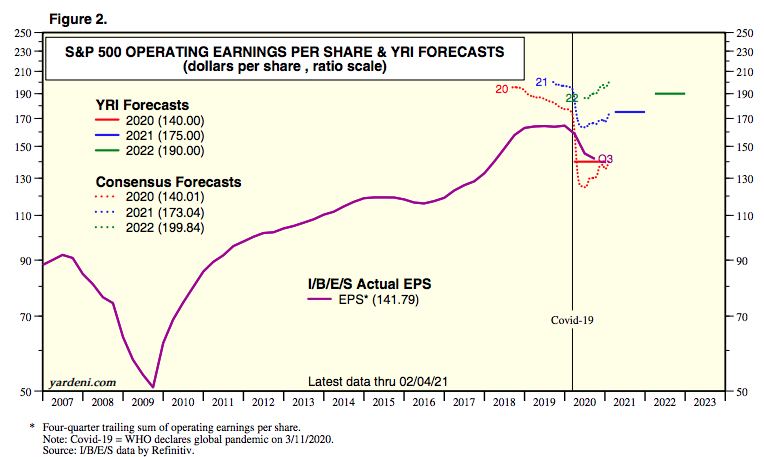
Based on the tally from analysts, they are now forecasting FY2020 EPS of just over $140 per share and more inline with Finom Group’s forecast.
Research Report Insight #6
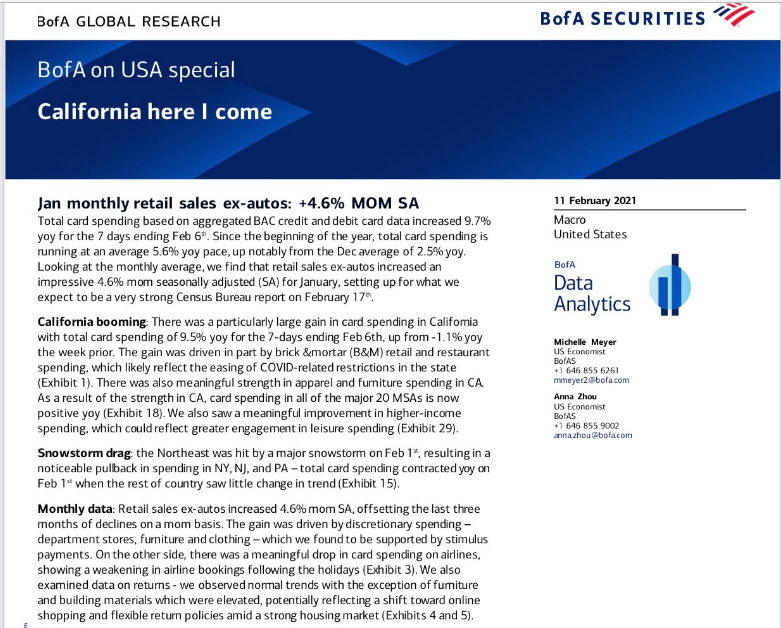
A look at the most recent Bank of America Card spending data shows that January was likely a very strong month for retail sales.
Research Report Insight #7
Market expectations of volatility and tail risk are still very high (e.g., as indicated by VIX, variance convexity, etc.), and historically that has been the main impediment for institutional buying of equities. The higher the level of the VIX, the lower the level of overall market exposure on behalf of Volatility Targeting and Hedge Fund participants. A break below 20 for the VIX, is likely to drive flows into equities and commodities, fueling markets further in 2021 even if not immediately.
History recognizes the aforementioned commentary, related to a declining VIX from elevated levels (above 20), as more than just speculation.
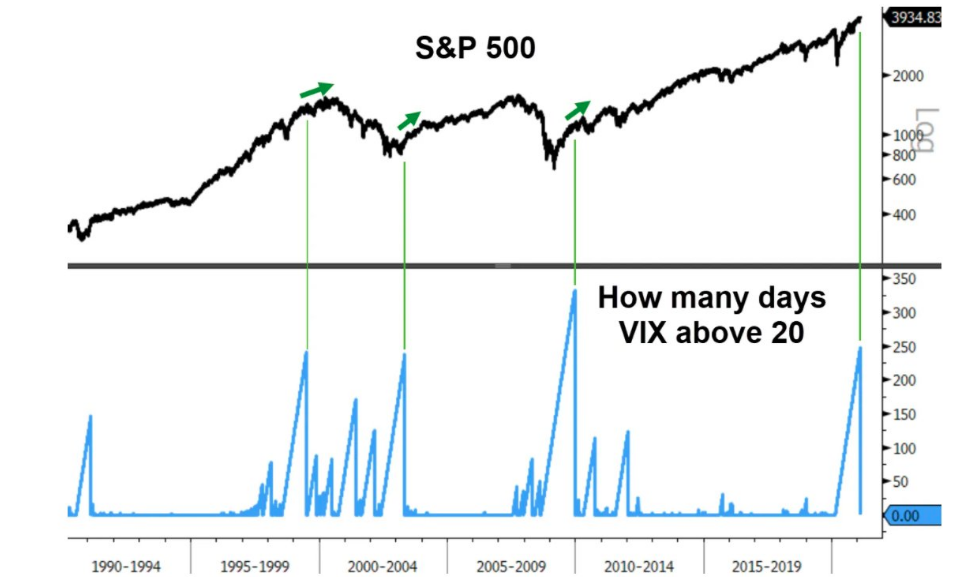
- Historical cases of elevated, but falling volatility led to more gains for stocks over the next 6-12 months:
- Dec 2009: S&P +12.6% over next year
- May 2003: S&P +16.4% over next year
- July 1999: bubble lasted another 9 months
Research Report Insight #8
The VIX is a calculation of S&P 500 put/call activity. In order to squeeze the VIX, there has to be an exceptional amount of S&P 500 put activity taking place, there is no other way.
S&P 500 > S&P 500 options > VIX > VIX Futures > VIX options > VIX-ETPs.
The S&P 500 options complex is largely governed by the institutional players, as the notional value of 1 contract is upwards of $300,000+ per contract. The WallStreet Bets crowd doesn’t have the ability, on volume, to create a squeeze given the dollars it would take to do so. This is why, in part, they are forced to buy VIX-ETPs or VIX options, not knowing that such activity won’t determine the outcome of the VIX. The tail does not wag the do so to speak. In fact, given the rise of this retail trader complex, what better way to squash the “rebellion” than to find them entering such a segment of the market, and allowing the institutions to volumetrically take the other side of that trade.
Research Report Insight #9
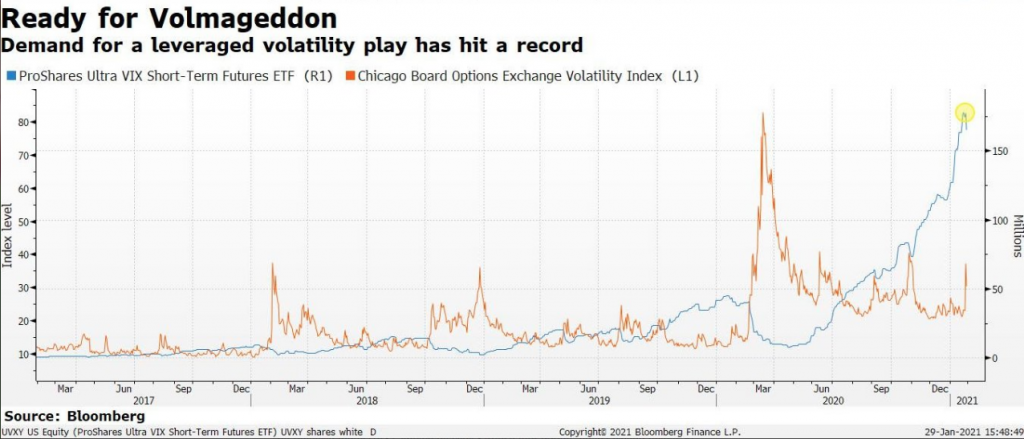
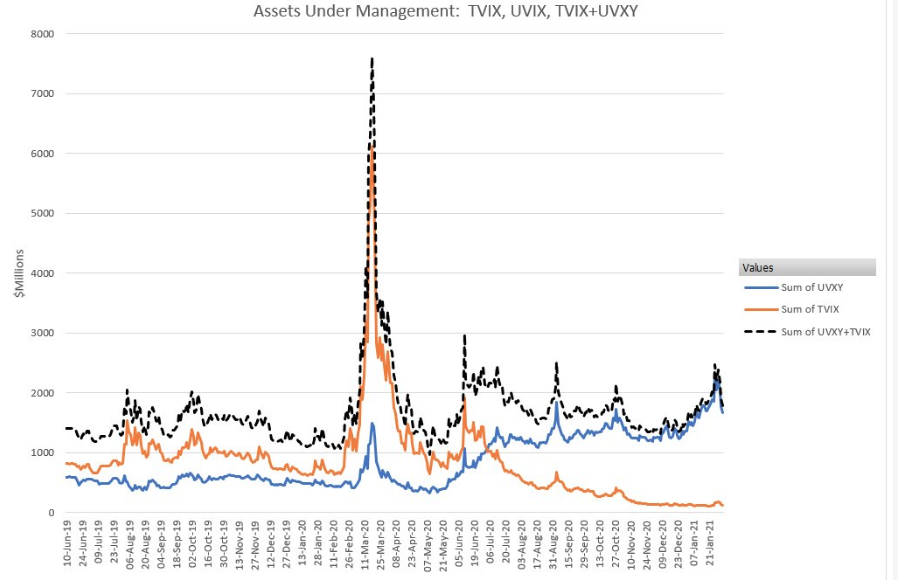
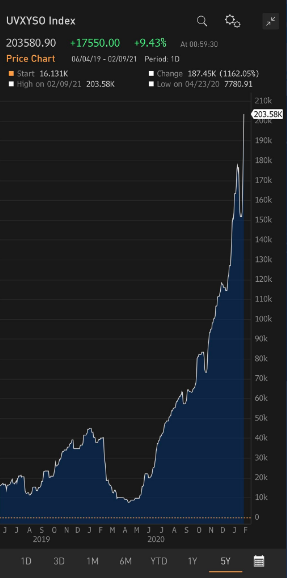
Seth Golden: “There are fewer VIX-Exchange traded products, with liquidity than ever before, given the termination of XIV in 2018 and TVIX in 2020. So with the S&P 500 rallying 76% off of the March lows and at record levels, hedging activity in such VIX-ETPs will prove elevated, given a lack of options in the complex when compared to past time periods. The following charts of UVXY open interest (OI) shows the rise dating back to June and since TVIX was terminated. (Blue line)
Secondly, if we are presuming the additional volume coming from the retail crowd, the reality is call option activity is a dangerous bet given these VIX-ETPs (UVXY) do not function as does a typical common stock like GME. Buying a call option in GME will directly affect the stock price if persistent volume is found and as the market maker aims to balance the risk by hedging off risk or selling stock. That can’t be said for a VIX-ETF, as purchasing UVXY common stock or call options will not affect the ETF, only price change in short-term VIX futures will.
ProShares and third-party Authorized Participants (market makers) have computer algorithms that ensure UVXY’s market price is always very close to the value of the S&P 500 VIX Short-Term Futures Index. If it diverges too much at any time, because a retail investor is purchasing a large amount of shares and pushes up the price for example, Authorized Participants will step in and short the necessary amount of stock. Similarly, if too many people are dumping their UVXY shares and it causes the price to sink below the value of the index it tracks, the Authorized Participants will step in and buy shares. Almost all of the “market making” in UVXY is done algorithmically. Also be it VXX or UVXY, they can both step in and issue more shares than a common company stock can do so, creating overhead supply (UVXY shares outstanding chart below)
Thank you for joining us for another trading week and reviewing our weekly “Must Knows”!
Disclaimer: The risk of loss in stock, stock/options, futures, futures/options, and forex trading is substantial, and site visitors and subscribers should consider whether trading these markets ...
more

