
BTC/USD Technical Analysis: Ripe For A Breakdown
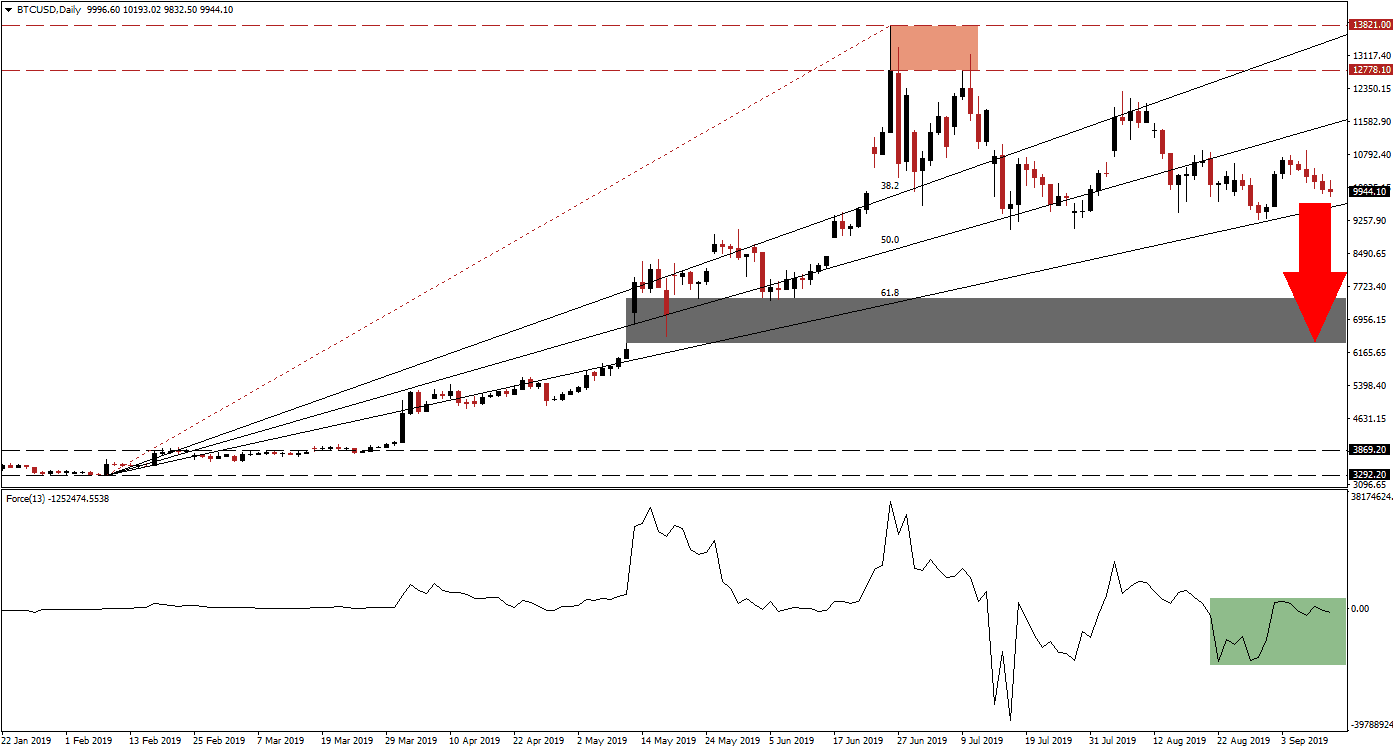
Bitcoin, the largest and most influential cryptocurrency, is once again turning lower which has created the fourth lower high since June of this year. The initial duo of lower highs, marked by the red rectangle in the chart, started the breakdown of the bullish trend for BTC/USD. After the second failed attempt to complete a breakout, profit taking followed which pushed this cryptocurrency pair below its 38.2 Fibonacci Retracement Fan Support Level, turning it into resistance and cemented the current intra-day high of $13,821.00. While fundamental developments favor a long-term rally in Bitcoin, the technical picture points to more weakness ahead before Bitcoin can attempt to sustain a rally. The 61.8 Fibonacci Retracement Fan Support Level is the last support level available before BTC/USD will enter the next leg lower.
What is the Fibonacci Retracement Fan?
The Fibonacci Retracement Fan is a different visualization of the Fibonacci retracement sequence which outlines important support and resistance levels in technical analysis. Those levels warrant a closer look and offer entry and exit levels for trades together with other aspects of the analysis.
The Force Index, a next generation technical indicator, has confirmed the breakdown in the bullish trend with a contraction of its own. Each lower high in Bitcoin was met by a lower high in the Force Index which is now trading below the 0 center line, confirming that bears are in control. The fourth lower high which was recorded at $10,891.60 could pose short-term resistance. The overall rise in bearish momentum is likely to result in a breakdown of BTC/USD below the 61.8 Fibonacci Retracement Fan Support Level which will cancel the general uptrend this cryptocurrency enjoyed since the start of this year.
What is the Force Index?
The force index is considered a next generation technical indicator. As the name suggests, it measures the force behind a move. In other words, forex traders will get a better idea behind the strength of bullish or bearish pressures which are driving price action. The indicator consist of three components (directional change of the price, the degree of the change and the trading volume). This creates an oscillator which in conjunction with other aspects of technical analysis provides a good indicator for potential changes in the direction of price action. It subtracts the previous day closing price from today’s closing price and multiplies it by the volume. Strong moves are supported by volume and create the most accurate trading signals.
A breakdown below the 61.8 Fibonacci Retracement Fan Support Level is expected to result in an accelerated move to the downside until price action will reach its next support zone, defined between $6,380.84 and $7,433.12. The wide range is the result of a price gap to the upside which could be closed if BTC/USD will complete a breakdown confirmed by the Force Index dropping below its most recent intra-day low, this is marked by the green rectangle in the chart. A fundamental catalyst would be required for Bitcoin to avert a breakdown scenario from current levels.
What is a Support Zone?
A support zone is a price range where bearish momentum is receding and bullish momentum is advancing. They can identify areas where price action has a chance to reverse to the upside and a support zone offers a more reliable technical snapshot than a single price point such as an intra-day low.
With bearish pressures on the rise, confirmed by the Force Index as well as the four lower highs, a breakdown below the 61.8 Fibonacci Retracement Fan Support Level remains the most likely outcome. Since this will represent the end of the uptrend, a big wave of sell orders is anticipated to accompany the breakdown which will further drive BTC/USD to the downside. While cryptocurrencies remain more disconnected from other asset classes, the deterioration of the global economy is having a negative impact on Bitcoin as well.
What is a Breakdown?
A breakdown is the opposite of a breakout and occurs when price action moves below a support or resistance zone. A breakdown below a resistance zone could suggest a short-term move such as profit taking by forex traders or a long-term move such as a trend reversal from bullish to bearish. A breakdown below a support zone indicates a strong bearish trend and the extension of the downtrend.
BTC/USD Technical Trading Set-Up - Breakdown Scenario
-
Short Entry @ 9,448.00
-
Take Profit @ 6,550.00
-
Stop Loss @ 10,335.00
-
Downside Potential: 289,800 pips
-
Upside Risk: 88,700 pips
-
Risk/Reward Ratio: 3.27
The breakdown scenario remains the most likely outcome, but the strength of the 61.8 Fibonacci Retracement Fan Support Level should not be ignored. Given the significance a breakdown will have on the long-term trend, volatility is expected to increase. In the even that this support level can hold a bearish attack, BTC/USD could quickly advance back into its resistance zone. This move would be guided higher by the 38.2 Fibonacci Retracement Fan Resistance Level.
What is a Resistance Zone?
A resistance zone is a price range where bullish momentum is receding and bearish momentum is advancing. They can identify areas where price action has a chance to reverse to the downside and a resistance zone offers a more reliable technical snapshot than a single price point such as an intra-day high.
BTC/USD Technical Trading Set-Up - Price Action Recovery
(Click on image to enlarge)
- Long Entry @ 10,350.00
- Take Profit @ 12,775.00
- Stop Loss @ 9,300.00
- Upside Potential: 242,500 pips
- Downside Risk: 105,000 pips
- Risk/Reward Ratio: 2.31
Disclaimer: DailyForex will not be held liable for any loss or damage resulting from reliance on the information contained within this website including market news, analysis, trading signals ...
more

