
Breakouts Imminent On Major US Equity Indices, Staying Power A Question Mark
Major US equity indices are itching to break out. The question is, what then? Indices remain stretched on several timeframes. Longs have shown dogged determination but shorts are likely to decide if the momentum will have the staying power.
Equity bulls deserve kudos for being so resilient. Time and again, they have taken a hit but only to get up right away – ready for another run.
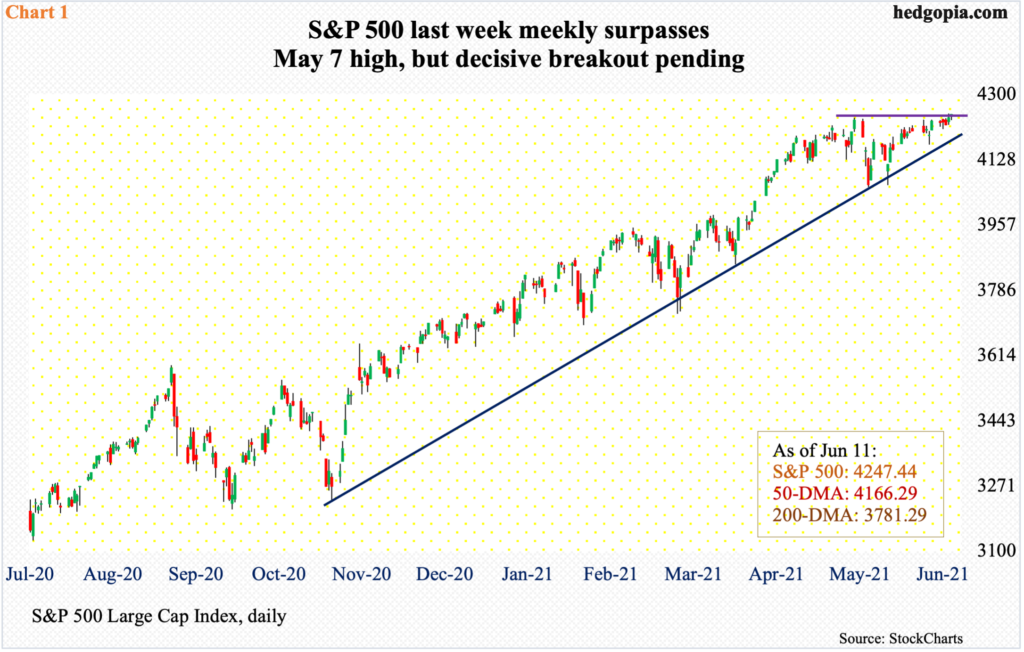
Take the S&P 500, where bulls have persistently found a reason to go long. Twice last month, this was the 50-day. On May 19 in particular, the large cap index breached the average intraday but only for bids to aggressively show up to end the session with a reversal hammer.
The index (4247) has had a tremendous run from its post-pandemic low of March last year. It is up 93 percent from that bottom. Four weeks ago, it lost a rising trend line from that trough. Nonetheless, it has managed to rally all along the underside of the trend line. Last Thursday, a new intraday high of 4249.74 was posted, ending the week looking like it is itching to break out (Chart 1). It has not yet busted through 4230s-40s.
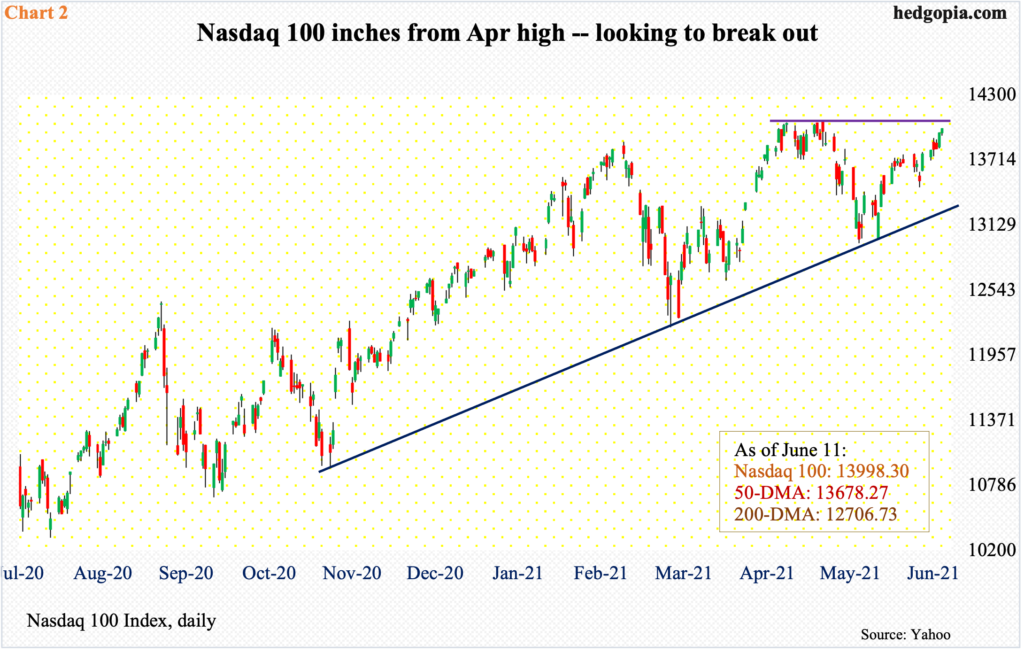
The Nasdaq 100 looks the same way. The tech-heavy index lost its March ’20 trend line as early as February this year. In fact, 2021 got off with January’s monthly long-legged doji. This was then followed by February’s dragonfly doji and March’s gravestone doji; April’s 5.9-percent rally tried to neutralize these candles, but May, down 1.3 percent, formed a hanging man. June so far is up 2.3 percent and is on course for another hanging man.
Despite all this, the index (13998) is a hair’s breadth away from a new high. On April 29, it retreated after tagging 14073 and faced difficulty in clearing 14000 for a couple of weeks before that. The level is now within reach (Chart 2).
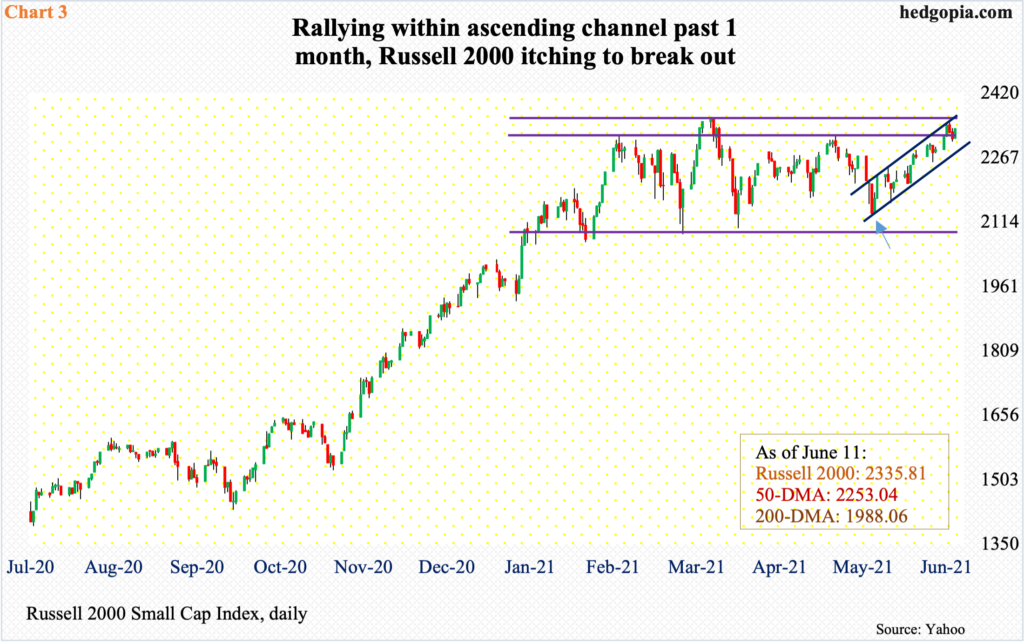
Recent action on the Russell 2000 is no less impressive. Small-cap bulls have pretty much been on the defensive since early February when the left shoulder of a potential head-and-shoulders pattern formed. A new record high of 2360.17 was set on March 15. Then, on April 28, the small cap index retreated after tagging 2310, which could potentially act as the right shoulder. The selloff that followed bottomed on May 12 when the index ticked 2132 (arrow in Chart 3) – well before the neckline at 2080s was tested.
After that, the Russell 2000 (2336) has traded within an ascending channel. As a matter of fact, last Wednesday it came within less than 10 points of its record high from March.
Momentum has suddenly swung the bulls’ way. Odds favor a new high soon.
The question then becomes, what then? Will the momentum sustain itself? All these three indices – and others – are extended on several timeframes. Feeble breakouts in all probability will lead to profit-booking. In the end, shorts could end up deciding how things evolve.
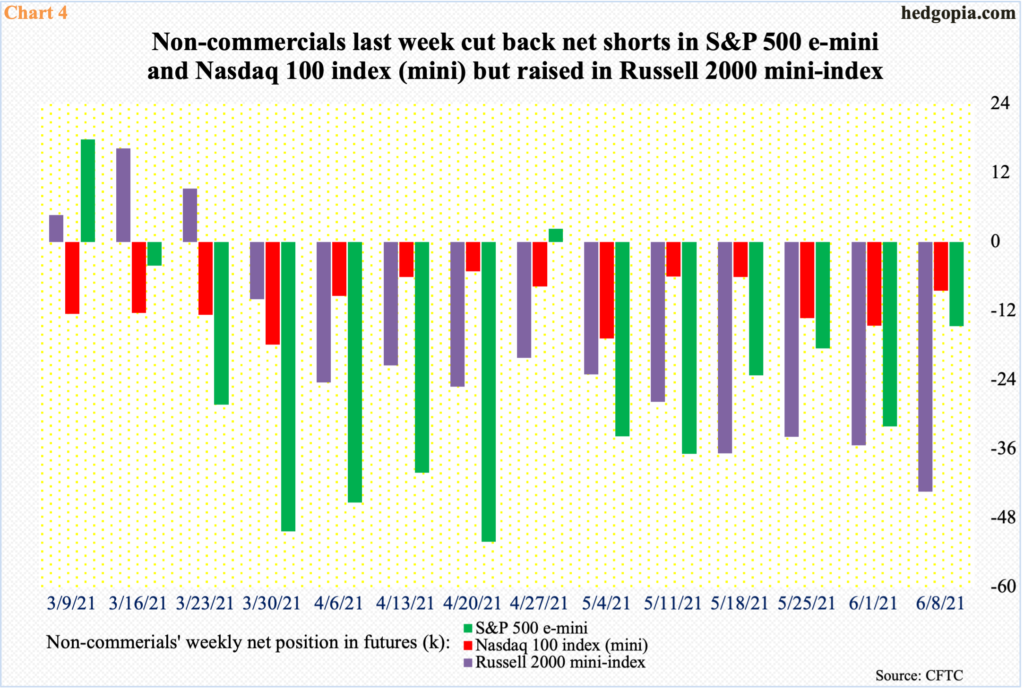
In the futures market, non-commercials are currently net short S&P 500 e-mini, Nasdaq 100 index (mini) and Russell 2000 mini-index contracts. In the latest week, they reduced their holdings in the first two but added in the latter. In Russell 2000, these traders are sitting on net shorts that are the highest since September 2019. This can very well act as fuel for squeeze.
Mid-February, non-commercials held nearly 80k contracts in S&P 500 e-mini shorts. Last week, this was down to just under 15k. The index is 300 points higher during the period.
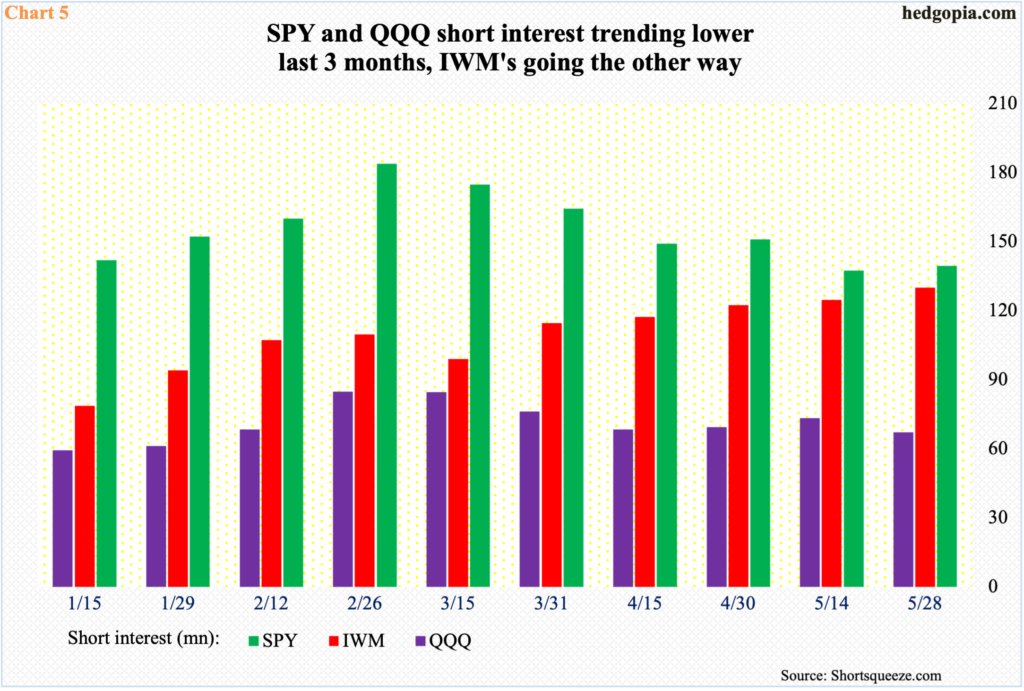
Elsewhere, too, small-cap shorts looked surer of themselves as they continued to add to IWM (iShares Russell 2000 ETF) short interest in the latest period.
Mid-May, IWM short interest reached 130.1 million shares, which was the highest since September 2015. In SPY (SPDR S&P 500 ETF) and QQQ (Invesco QQQ Trust), short interest – currently 139.6 million and 67.2 million respectively – has declined since the end of February (Chart 5).
Short squeeze is a possibility particularly in IWM.
Interestingly, all these indices are at/near record highs, yet sentiment is yet to reach exuberance. It was earlier.
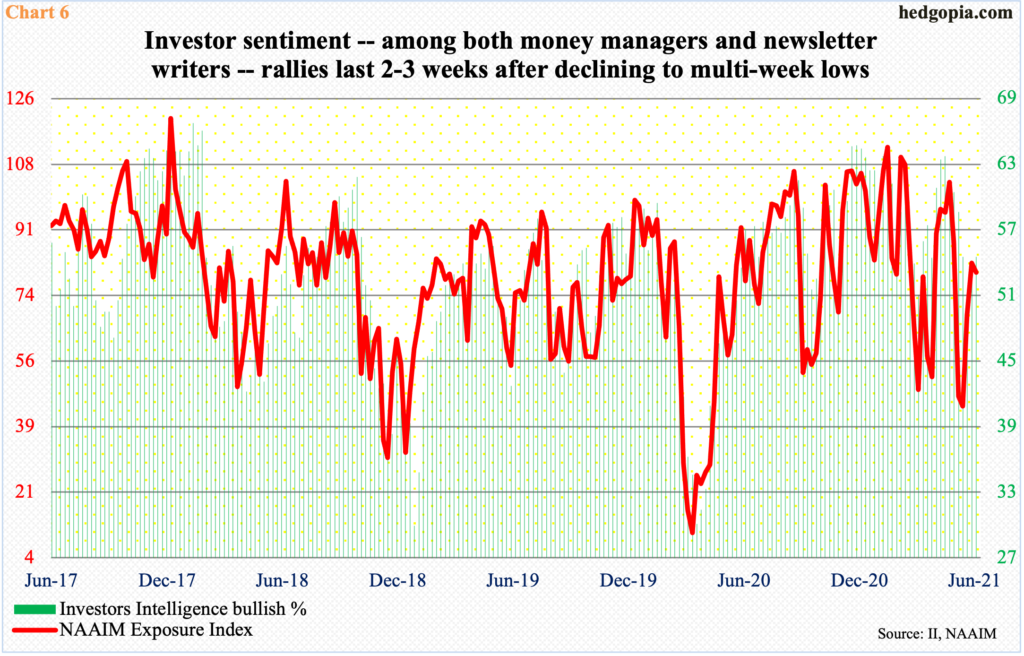
In the last week of April, the NAAIM Exposure Index, which measures National Association of Active Investment Managers members’ average exposure to US equity markets hit 103.7. Readings above 100 are rare. A week before that, Investors Intelligence bulls rose to 63.7 percent – a 19-week high. Last week, they were respectively 79.7 and 54.5 percent, having earlier bottomed at 44.2 and 51.5 percent three and two weeks before that, in that order (Chart 6).
In ideal circumstances for equity bulls, sentiment has room to firm up. The NAAIM index’s drop to 44 occurred in the week to May 19 when the S&P 500 bottomed just below the 50-day; Investors Intelligence’s bottomed in the week to May 25. Sentiment followed the index higher, or it was the other way around.
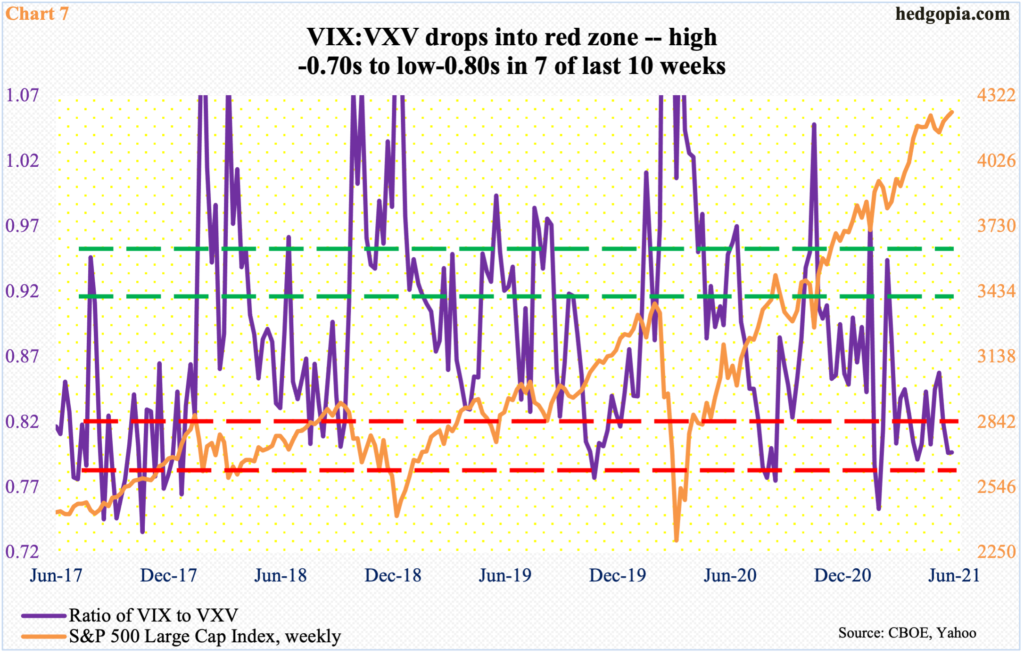
As these variables play themselves out in the sessions ahead, it is prudent not to completely take eyes off Chart 7.
The chart shows a ratio of VIX to VXV. VIX measures expectations for 30-day volatility using S&P 500 options. VXV does the same except it goes out to 90 days. When traders are in a mood to take on risk, shorter-term contracts lose premium faster, in this case VIX. A lower ratio hence suggests nearer-term volatility is suppressed.
Last week, VIX (15.65) hit 15.15 twice – on Tuesday and Friday. A breach raises risks of a journey toward the low-teens. In this scenario, VIX:VXV continues to remain suppressed. In seven of the last 10 weeks, the ratio already hit high-0.70s to low-0.80s (Chart 7). This is oversold territory and will get unwound – just a matter of time.
Thanks for reading!
Disclaimer: This article is not intended to be, nor shall it be construed as investment advice. Neither the information nor any opinion expressed here constitutes an offer to buy or sell any ...
more

