
Both Corporate Buybacks And Bond Issuance Surprise On The Upside
S&P 500 companies spent $198 billion in buybacks in 1Q, up 9.3 percent sequentially. Given the uncertainty surrounding stocks and the economy, this must come as a nice surprise. Concurrently, there has been a jump in recent months in C&I loans and corporate bond issuance. Those funds are probably not going to find a home in buybacks, which should begin to weaken beginning 2Q.
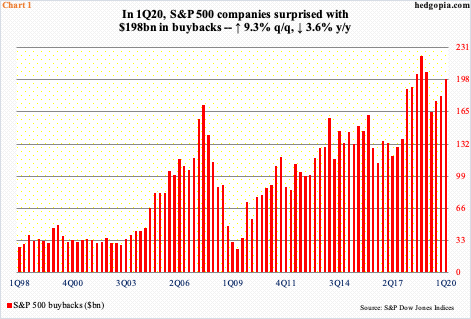
With 95 percent of the data in, S&P 500 companies in 1Q20 spent $198.4 billion in buybacks (Chart 1), up 9.3 percent quarter-over-quarter and down 3.6 percent year-over-year. Buybacks held up pretty well given the coronavirus-spurred disruptions to the US economy and the stock market. Between the February 19th peak and the March 23rd trough, the S&P 500 large-cap index collapsed 35.4 percent, even as the economy entered a recession.
Investors were bracing for a much worse buyback number. In the end, the surprise was to the upside. The only explanation is that most companies updated their buyback plans in March, hence the first quarter was pretty much locked in. Buybacks should meaningfully begin to weaken beginning 2Q.
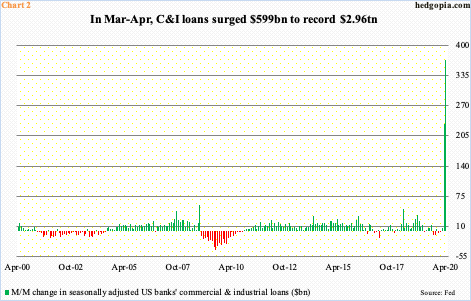
The better-than-expected buybacks come amidst a massive surge in US banks’ commercial & industrial loans in March and April. Combined, C&I loans jumped $599.1 billion in those two months, to $2.96 trillion – a new record. Just look at how wacky the two bars on the right side of Chart 2 look.
A large portion of this surge is related to the government’s paycheck protection program (PPP). Under this, small-business borrowers can apply for low-interest loans, 75 percent of which needs to be spent on payroll and the remaining 25 percent on other expenses such as rent and utilities. Through May 30th, there have been two rounds for a total loan of $510.2 billion. The second round rolled out April 27th. The first one began April 3rd and by the 16th had loaned out $349 billion. All of this is captured in April’s $368.7-billion jump in C&I loans.
But C&I loans also went up by $230.5 billion in March. PPP was not a factor back then. It is possible some of this went into buybacks. But for the most part corporations were simply in a mood to raise cash – just in case. Rates are low and the economy is surrounded in a lot of Covid-19 uncertainty. There is nothing wrong in tapping credit lines and sitting on cash when times are uncertain.
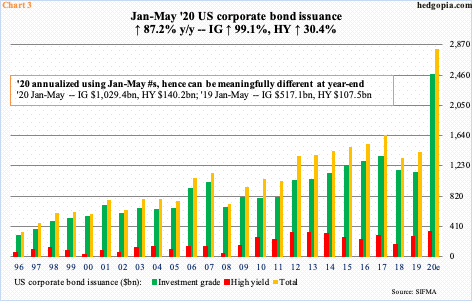
The same phenomenon is also evident in US corporate bond issuance.
Through May, a total of $1.17 trillion, made up of $1.03 trillion in investment-grade and $140.2 billion in high-yield, has been issued. From last year, this is up 87.2 percent, 99.1 percent and 30.4 percent, in that order! At the current pace, $2.81 trillion would have been issued this year, which is what is portrayed in Chart 3. That said, there is no guarantee that the pace in the first five months continues in the remaining seven. When it is all said and done, 2020 bars can look a whole lot different, but it does help drive home the point that issuance so far has been red hot.
Perhaps more importantly, this aggression shown by corporations comes at a time when fundamentals are deteriorating. Mid-May, S&P Global Ratings put the number of fallen angels at 24. These are issuers downgraded to speculative-grade from investment-grade. This is the highest number of fallen angles since 2015. Of the 24, 17 are US-based. Further, the number of potential fallen angels has reached 111 globally, 45 of which are US-based.
Interesting times lie ahead.


