
BIIB Medium Term Elliott Wave Analysis
Biogen Incorporation (BIIB) is an American multinational biotechnology company specialized in discovery, development, manufacturing, and delivery of therapies for the treatment of neurogenetics, hematologic and autoimmune disease. The company currently employs 7800 people approximately.
BIIB stock's value has declined 34% from 2018-2019 with net income dropping down to $1.72 billion from $2.61 billion last year. However, in this blog, we will take a look at the technical picture of the stock using the Elliott wave theory to identify future price action in the stock below.
BIIB Weekly Analysis
(Click on image to enlarge)
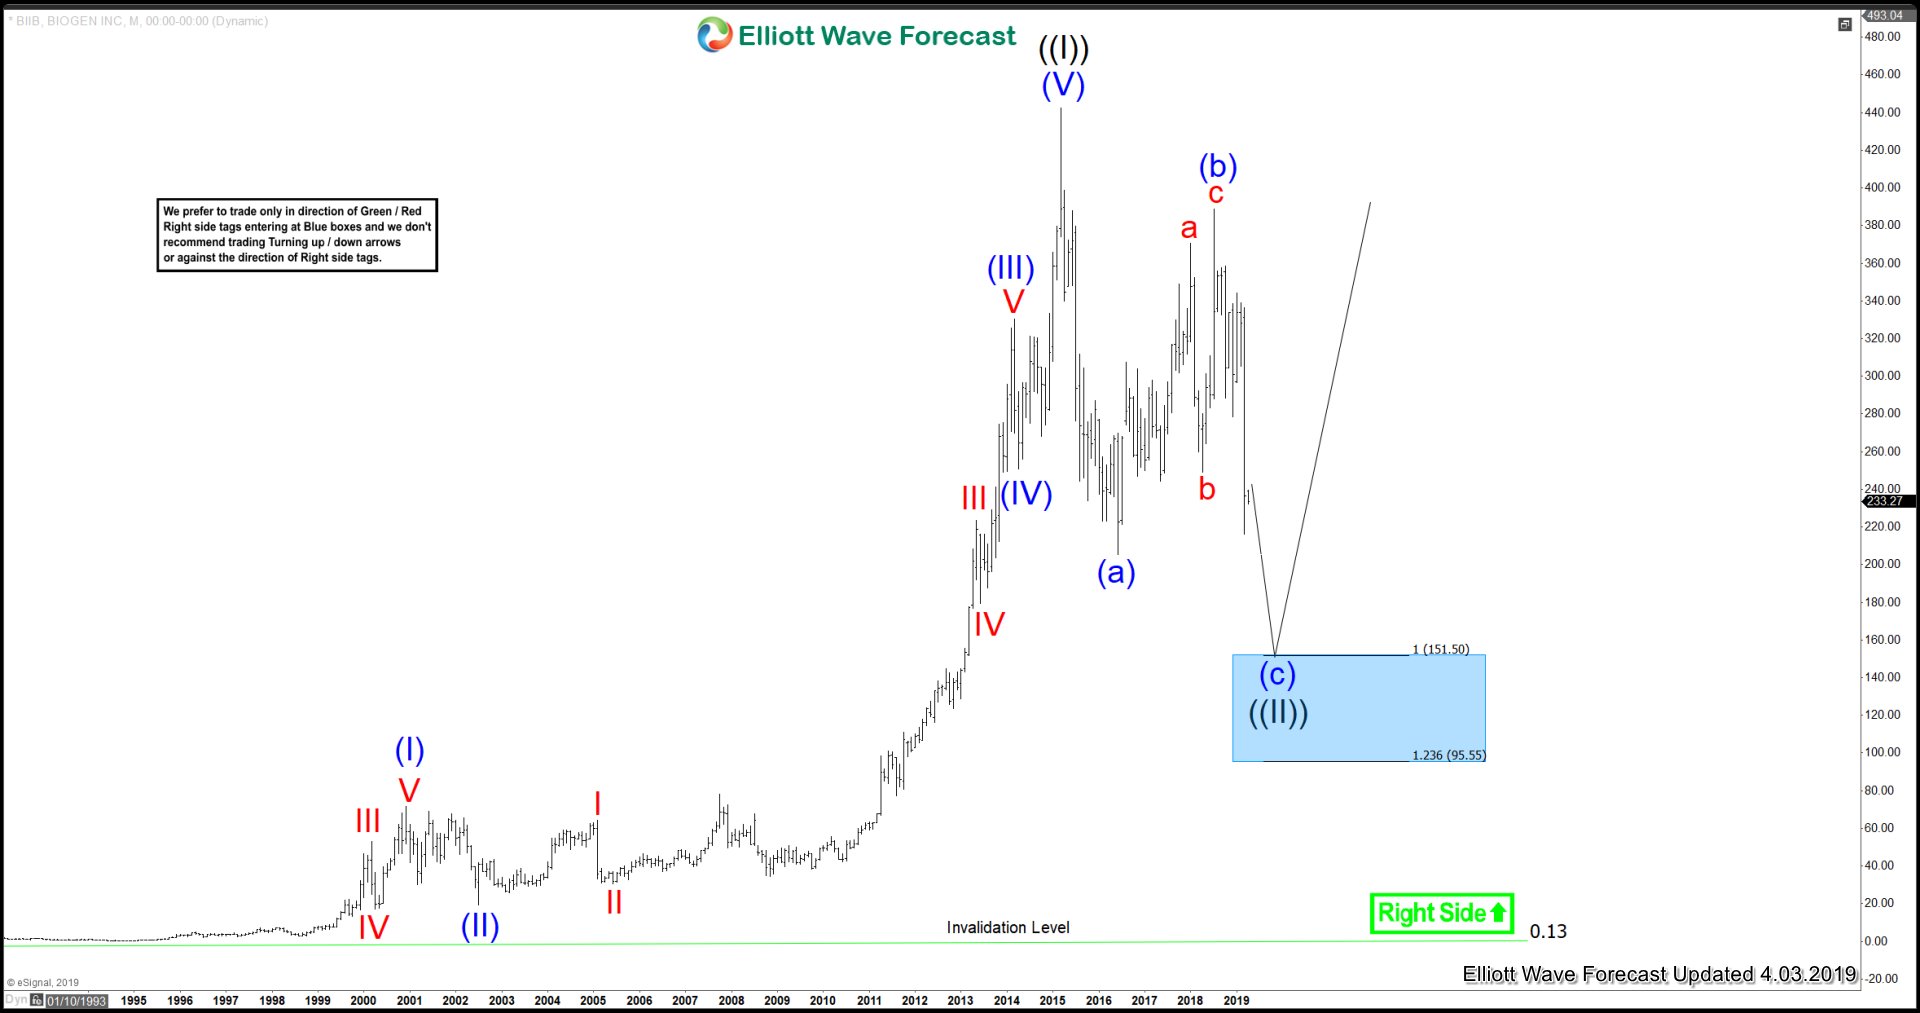
Looking at Weekly Time Frame Chart, the cycle from All time lows is complete at $442.29 high seen on 3/20/2015 peak in Grand Super Cycle degree. Down from there, the stock is doing a bigger 3 wave pullback to correct the all-time low cycle within Grand Super Cycle degree wave ((II)).
The pullback from the peak takes the form of an Elliott wave zigzag structure where Super Cycle degree wave (a) ended at $205.42 low. Wave (b) bounce ended in lesser degree zigzag structure at $388.83 high. Wave (c) lower remains in progress towards $151.50-$95.55 100%-123.6% Fibonacci extension area of (a)-(b).
BIIB Daily Analysis
(Click on image to enlarge)
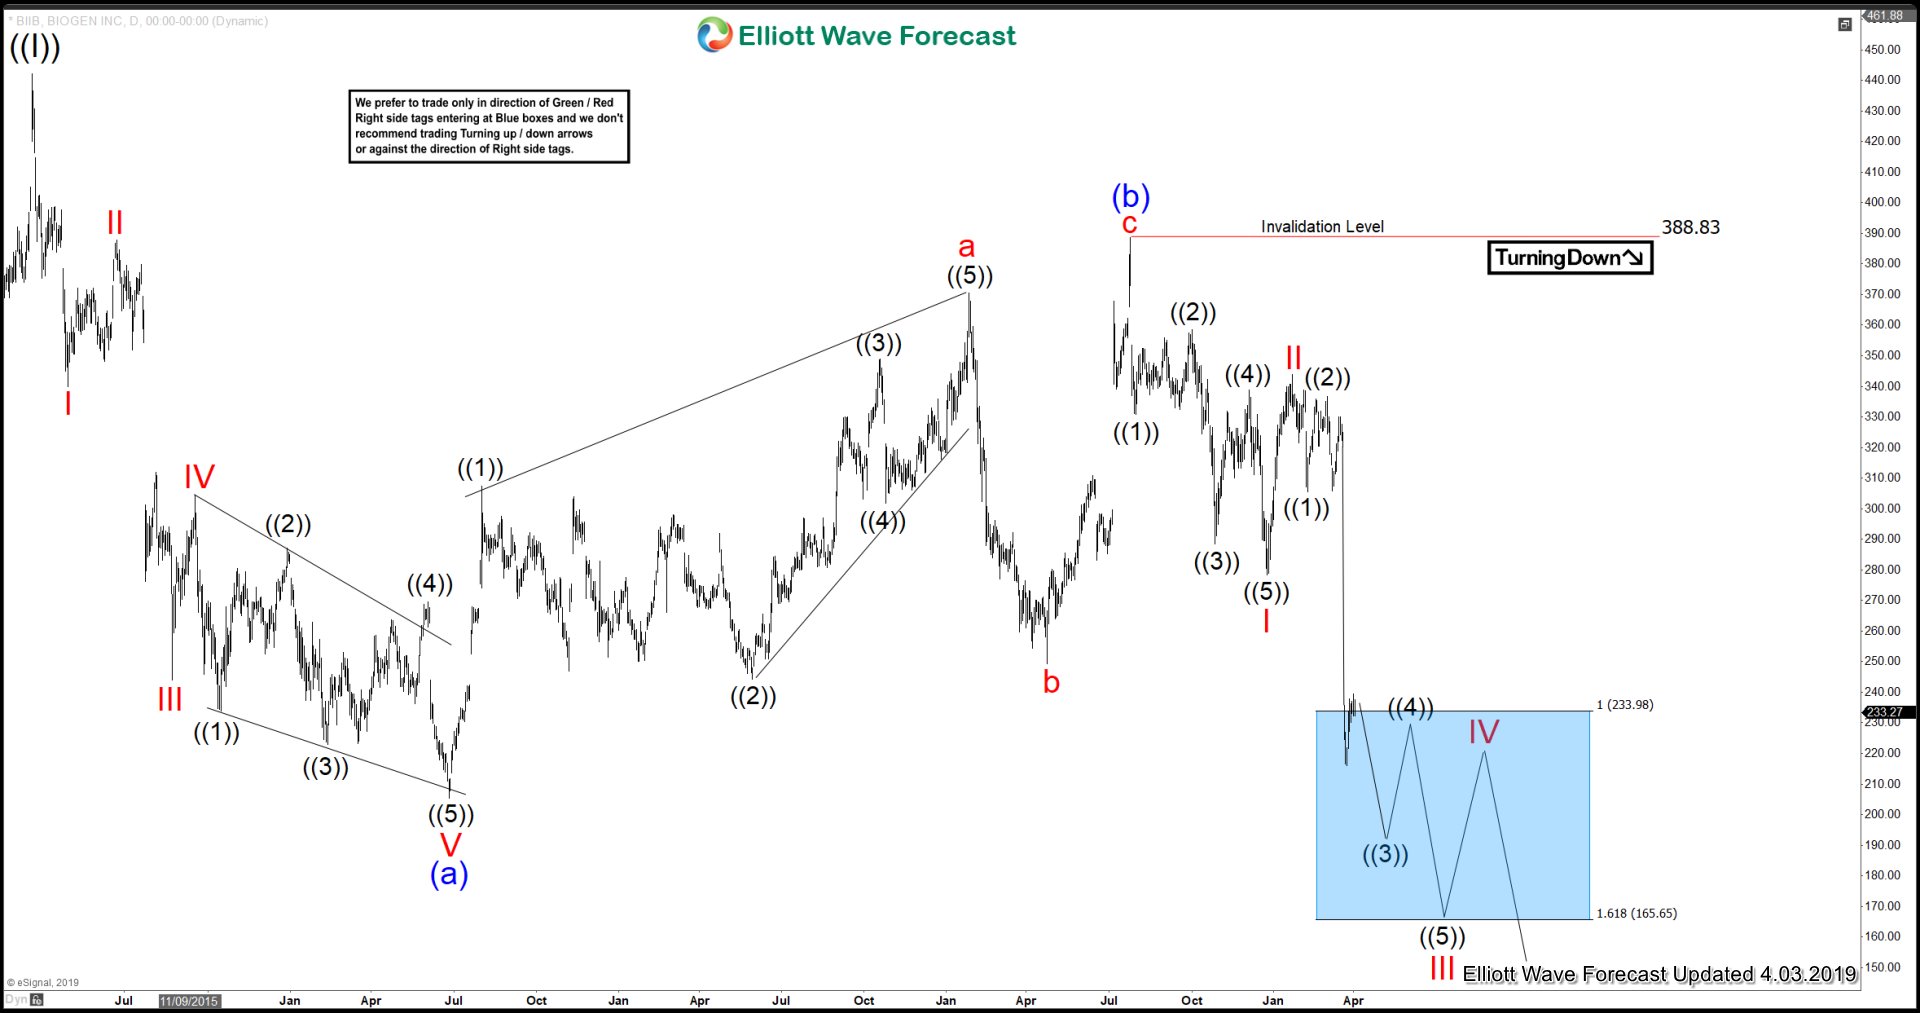
Here's the Daily Time frame Chart, suggesting that as far as a pivot from $388.83 high stays intact near-term bounces should fail in 3, 7 or 11 swings for more downside in the stock towards $151.50-$95.55 area lower within wave Super Cycle degree wave (c). This area should see buyers for next cycle higher or bigger 3 waves bounce at least.
BIIB Daily Alternative Analysis
(Click on image to enlarge)
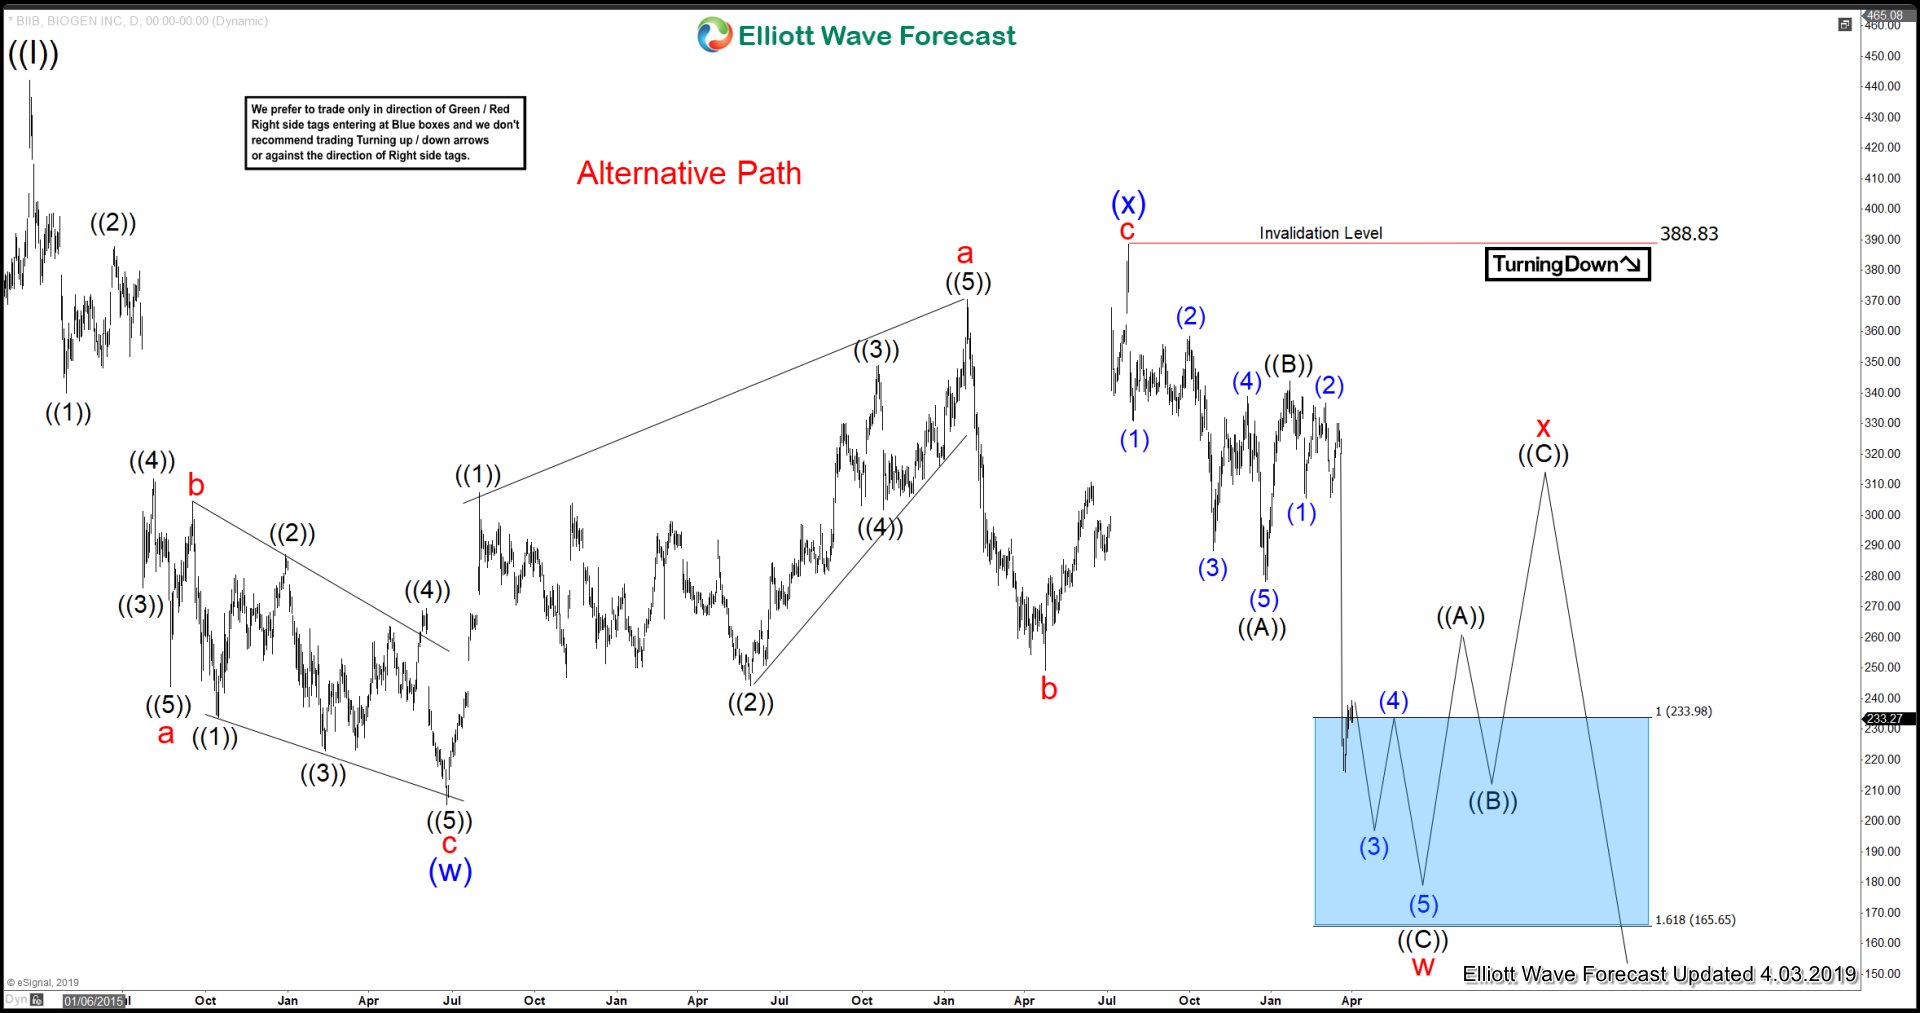
Above is the Daily Alternative view Chart, in which the degree of pullback from 3/20/2015 peak can be unfolding as double three structure instead of zigzag structure. In this scenario, the decline to $205.42 low ended Super Cycle degree wave (w) with subdivision of a zigzag structure. Then a bounce to $388.83 high ended wave (x) with subdivision also as a zigzag Elliott Wave structure.
Down from there, wave (y) can be unfolding as double three structure where it can be ending cycle degree wave w in red at $233.98-$165.65 100%-161.8% Fibonacci extension area of ((A))-((B)). Then from there, the stock can see a 3 wave bounce against $388.83 high before a final extension lower towards $151.50-$95.55 area lower can be seen.
Keep in mind that the market is dynamic and the view could change in the meantime. Success in trading requires proper risk and money management as well as an understanding of Elliott Wave theory, cycle analysis, and correlation. We have developed a very good trading strategy that defines the entry. Stop loss and take profit levels with high accuracy and allows you to take a risk-free position, shortly after taking it by protecting your wallet.
Disclaimer: Futures, options, and over the counter foreign exchange products may involve substantial risk and may not be suitable for all investors. Leverage can work against you as well as for ...
more

