
BigTrends Weekly Market Outlook - Economy, Market, Sentiment, Sector
Though last week ended up being a merely mediocre one for the stock market, the entire month of October ended up being the best month for stocks in four years. All told, last week's 0.2% advance for the S&P 500 (SPX) (SPY) meant an 8.2% advance for the calendar month.
And yet, despite the decidedly bullish momentum, the indices are not at multi-month new highs... a testament to how nasty August's pullback was. On the flipside, the indices are above all the key moving average lines and we are at a time of year that's generally bullish for stocks. A little bullish verification could go a long way.
We'll weigh everything below. First, however, we'll run down last week's big economic news.
Economic Data
Though last week was loaded with economic data, not a great deal of it was heavy-hitting.
The biggest news, of course, was the decision from the Federal Reserve to not alter the Fed Funds rate in October from its current rate of 0.25%. But, the Fed did make it clear a December rate hike was still a distinct possibility even though the market had effectively dismissed the idea. With the Federal Reserve suggesting the economic situation may be better than it superficially seems, traders were willing to buy in the wake of the news... even if that bullishness didn't last.
We also learned the initial reading on Q3's GDP growth was a less thrilling 1.5%, versus a final growth reading of 3.9% in Q2. The Q3 number, however, will be revises two more times, so don't get married to the figure.
It was also a fairly important for real estate, with an updated pace of new-home sales as well as August's Case-Shiller Index of home prices.
Prices were fine; they grew 5.1% (on a year-over-year basis) two months ago. But, new-home sales suspiciously fell to an annualized pace of 468,000. That's the weakest reading since last November.
Real Estate Prices and New Home Sales Chart
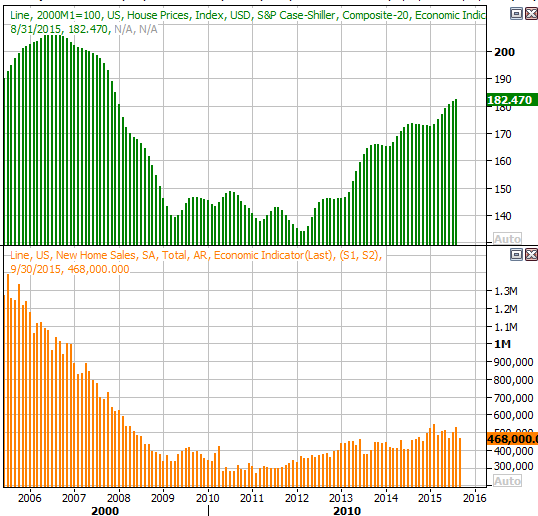
Source: Thomas Reuters
We also got updates on both key consumer sentiment measures... the Conference Board's consumer confidence index, and the Michigan Sentiment Survey. Both fell. Though it's not unusual to see one or the other fall in any given month, this is the first time in a long time both have fallen to this degree. It may be worth keeping close tabs on from here, as sentiment ultimately drives the market.
Consumer Sentiment Chart
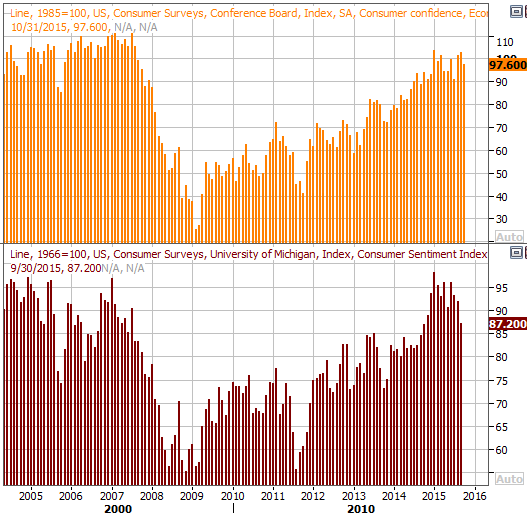
Source: Thomas Reuters
Everything else is on the following grid:
Economic Calendar
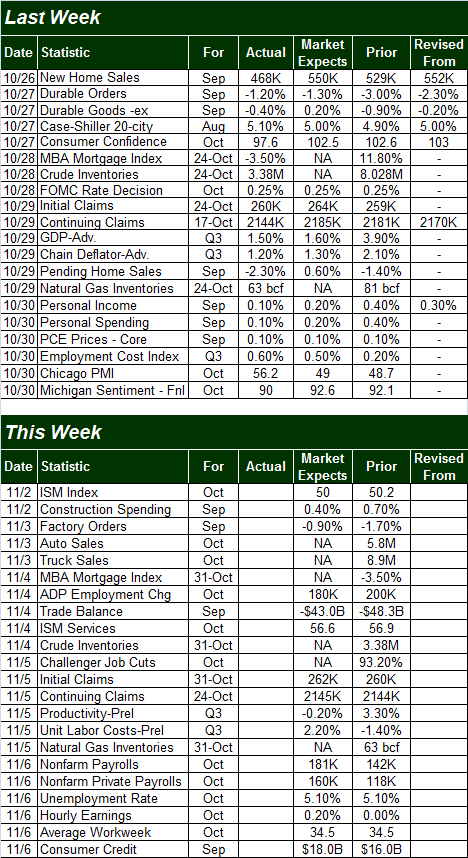
Source: Briefing.com
This week will be just as busy, though the highlight won't come until the last day of the week when we hear October's employment data. The pros are expecting slightly better job growth of 181,000 jobs, though that's not apt to be enough to move the unemployment dial from 5.1%. Net job additions are reaching an alarmingly slower pace.
Employment Trends Chart
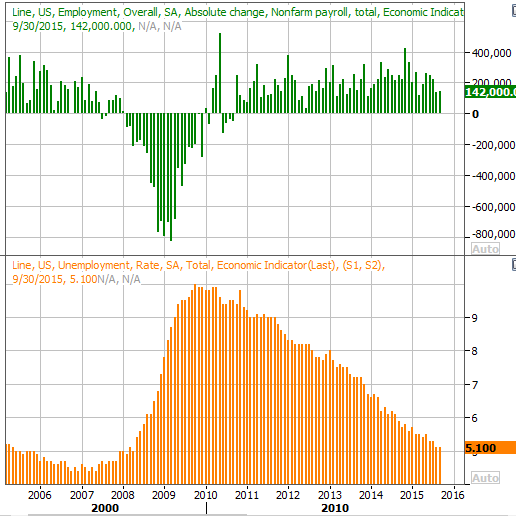
Source: Thomas Reuters
Stock Market Index Analysis
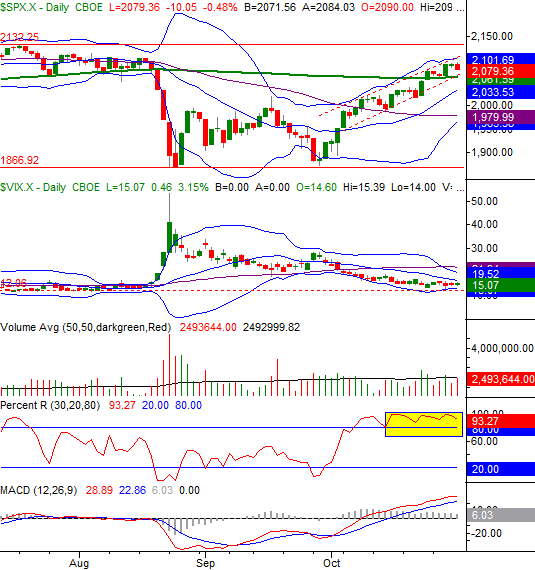
While the market finished the week on a bearish note -- with a 0.5% stumble from the S&P 500 -- the bigger-picture uptrend is still intact; that trend is framed by dashed lines on the chart below. Note also that even though it waffled a bit since confirming the uptrend in mid-October, the Percent R indicator has remained above the 80 threshold, maintaining its bullishness.
S&P 500 & VIX Daily Chart
Chart created with TradeStation
Of course, on a much more basic level, the fact that the S&P 500 is above its 200-day moving average line (green) along with every other moving average line speaks volume about stocks' momentum.
It's not a perfect, bulletproof bullishness though. The S&P 500 has yet to move above the mid-2015 peak around 2133. It's entirely possible the index will need to hit or just slightly exceed that level to draw out the would-be sellers. The fact that the CBOE Volatility Index (VIX) (VXX) has stopped moving lower at an established floor near 12.0 could be a subtle sign that the rally is running out of gas as the index approaches an established ceiling.
Here's a slightly different look at the S&P 500 - a look at the put/call ratio and its key moving average lines. It's been trending lower since late-September as the market has been trending higher... as it should have. This downtrend is worth looking at now, however, just to see that it's still intact. In other words, the put/call ratio underscores the market's momentum, even if it may look and feel like the put/call reading should be finding a floor soon.
S&P 500 Daily Chart, With VIX and Put/Call Ratio
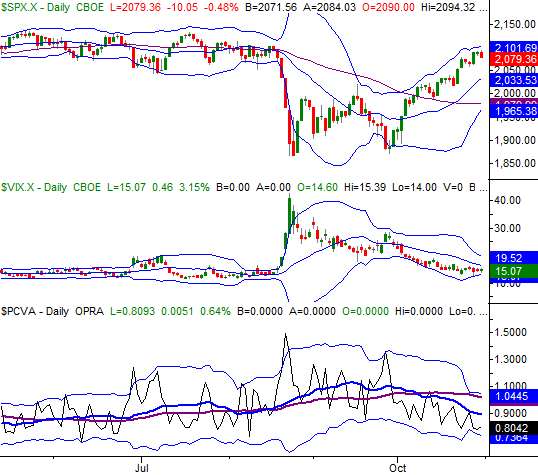
Chart created with TradeStation
This is a chart we'll be keeping close tabs of for a while, as it's very likely the market's rollover will first be cued by a decisive upward turnaround from the put/call ratio.
With all of that being said, one of the missing ingredients of the market rally to date has been small caps - the Russell 2000 Small Cap Index (RUT) (IWM) hasn't participated nearly as much or as well after hitting its bottom in late September. However, a key line in the sand at 1180 has been defined. After making something of an upside-down head-and-shoulders that's taken shape since August, a thrusting move above 1180 could be quite catalytic.
Russell 2000 Daily Chart
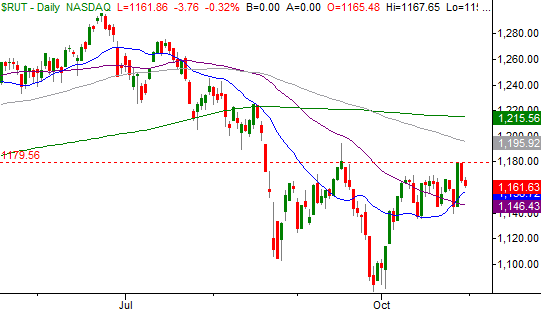
Chart created with TradeStation
Bottom Line: The trend is bullish, though it would be much easier to have confidence in the trend with just a couple more confirmations of that bullishness. These confirmations are discussed above. On the flipside, the unusually bullish October absolutely requires keep a close eye and a short leash on stocks, as there are plenty of potential profits to be taken. Aside from a rising put/call ratio, look for the S&P 500's break under the 200-day moving average line (at 2061) to mark the beginning of such a pullback.
Consumer Staples Shrugging Off Marketwide Volatility
Think every sector has been dishing out volatility, with no stock of any size being immune to that volatility? Think again. The S&P 600 Small Cap Consumer Staples Index (XLP) has been consistently moving higher, pushing up and off the 200-day moving average line (green) since early 2014.
S&P 600 Consumer Staples Chart
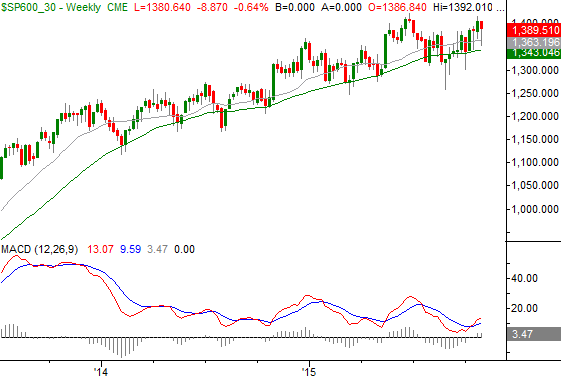
Chart created with TradeStation
That trend isn't apt to stop anytime soon either, particularly if the rest of the market continues to struggle.
Disclosure: None.


