
Berkshire, Metals, Financials, And Gold
Berkshire Hathaway (BRK-B) has not been acting as in the past during the last several years.
Its performance depends on its portfolio.
The business cycle helps to understand the change.
This article looks at the technical performance of the price of Berkshire Hathaway and how it relates to gold, metals, and financial stocks.
Source: StockCharts.com
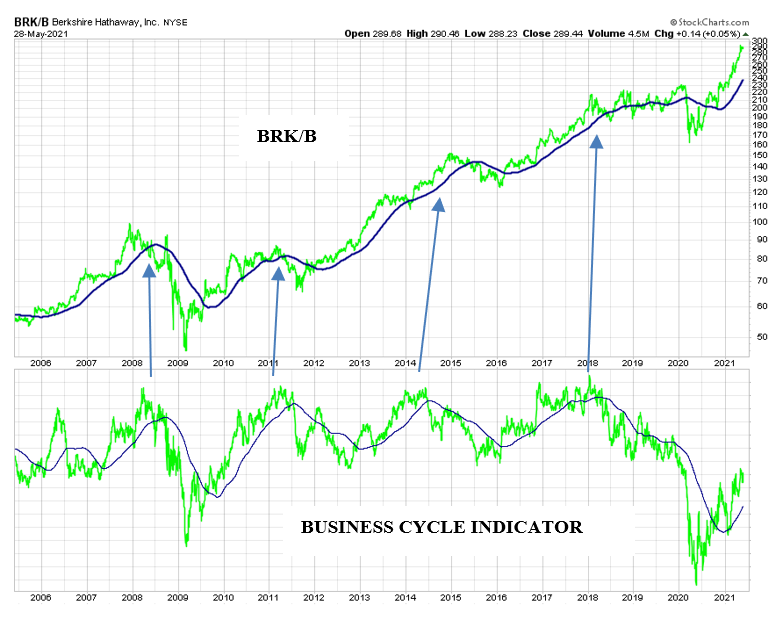
The above chart shows the price of Berkshire in the upper panel. The lower panel shows the business cycle indicator as updated in real time.
The business cycle indicator reflects the decision of business managers to replenish depleted inventories. A rising business cycle indicator measures the strength of the activities needed to replenish inventories - the purchase of raw materials, hiring of new workers, and the increase of borrowing to finance new capacity and on-going operations.
During such times commodities, wages, interest rates and overall inflation rise. The equity markets respond by favoring industrial, material, financial, and energy stocks. Defensive sectors such as utilities, staples, health care, and bonds underperform the market during this period.
The business cycle peaks because rising interest rates, energy prices, and overall inflation reduce consumers’ purchasing power. The outcome is slower growth in demand. Business does not recognize what is happening and lets inventories build up.
Eventually rising inventories have a negative impact on profitability. Business is forced to cut production to reduce inventories. It decreases purchases of raw materials, cuts the labor force. It also borrows less to reduce interest costs. The outcome is lower commodity prices, lower wages, and lower interest rates. The result is steadily declining inflation.
During such times sectors such as staples, healthcare, utilities, and bonds outperform the markets. Cyclicals, industrial, metals and mining, and financials underperform the markets.
Despite its phenomenal performance, Berkshire stock responds to the trend of the business cycle. A decline in the business cycle indicator, indicating slower economic growth, is reflected by a slowdown in the price appreciation of Berkshire (see above chart). The sharpest gains in its stock price take place when the business cycle rises and the economy strengthens.

Source: StockCharts.com, The Peter Dag Portfolio Strategy and Management
The above chart shows the business cycle indicator in the lower panel. The upper panel shows the performance of Berkshire compared to metal and mining stocks (ETF: XME). The graph is obtained by dividing the price of Berkshire by the price of XME.
The graphs show XME outperforms Berkshire (the ratio decline) when the business cycle rises due to a strengthening economy. When the economy weakens and the business cycle declines, Berkshire outperforms XME.
The above chart is similar to the relationship between XME and gold (GLD).
Source: StockCharts.com, The Peter Dag Portfolio Strategy and Management
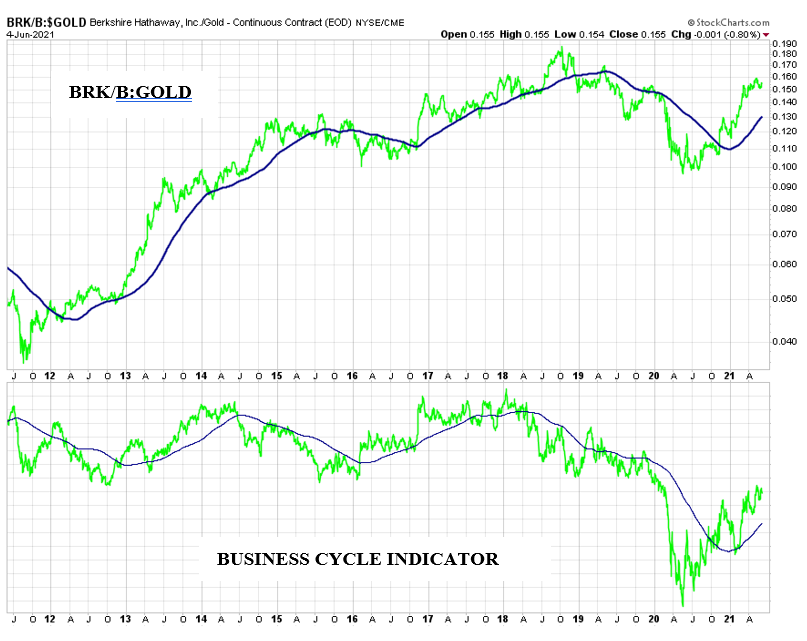
The above chart shows the business cycle indicator in the lower panel. The relative performance of BRK/B and gold is shown in the upper panel. BRK/B outperforms gold when the business cycle rises, and the economy strengthens. On the other hand, BRK/B underperforms gold when the economy is weakening, and the business cycle declines.
I have also looked at the cyclical pattern of bank stocks and how they relate to interest rates (not that obvious). One of the findings is that bank stocks have a pronounced cyclical behavior. They outperform the market (SPY) when the business cycle rises. They underperform the market when the business cycle declines. These tendencies are similar to those of BRK/b (see first chart).
Source: StockCharts.com, The Peter Dag Portfolio Strategy and Management
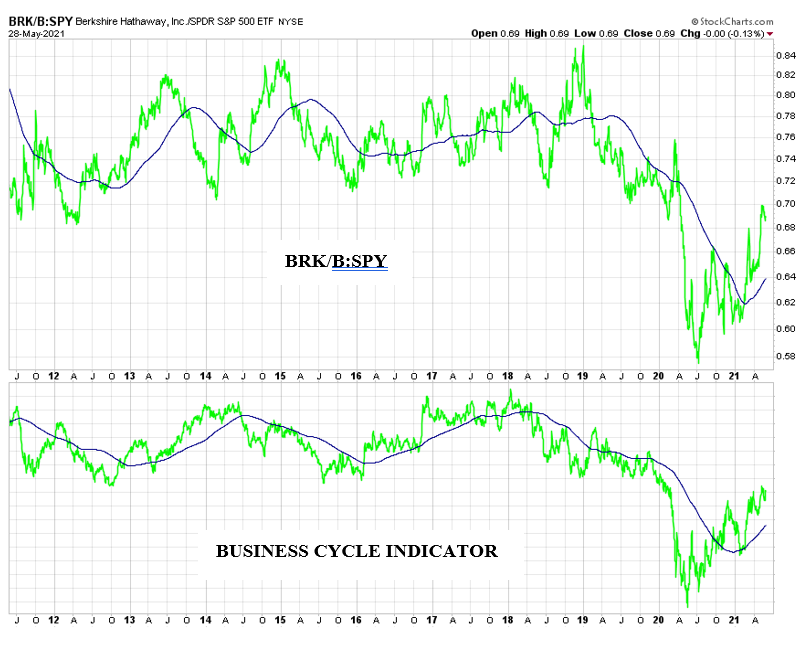
The above chart shows in the upper panel the performance of Berkshire compared to SPY (the graph shows the ratio of the price of Berkshire divided by SPY). The chart shows Berkshire outperforms SPY when the business cycle strengthens. It underperforms SPY when the business cycle declines. In other words, Berkshire performs like a bank stock during the business cycle.
Key takeaways
- Berkshire outperforms the market when the business cycle rises. It underperforms the market when the business cycle declines.
- Berkshire responds like a bank stock to the trend of the business cycle.
- Berkshires outperforms gold when the business cycle rises and underperforms gold when the business cycle declines.
- XME outperforms Berkshire and gold when the business cycle rises.
- XME underperforms Berkshire and gold when the business cycle declines.
Subscribe to The Peter Dag Portfolio Newsletter by clicking here.


