
Bears, Breakdown And USD/JPY
After three unsuccessful attempts to go lower currency bears finally gathered enough strength to launch the attack earlier today. Thanks to their action, USD/JPY declined sharply, erasing many days of increases generated by the bulls. How low can the currency pair fall in the coming days?
EUR/USD – Trading in the Triangle
(Click on image to enlarge)
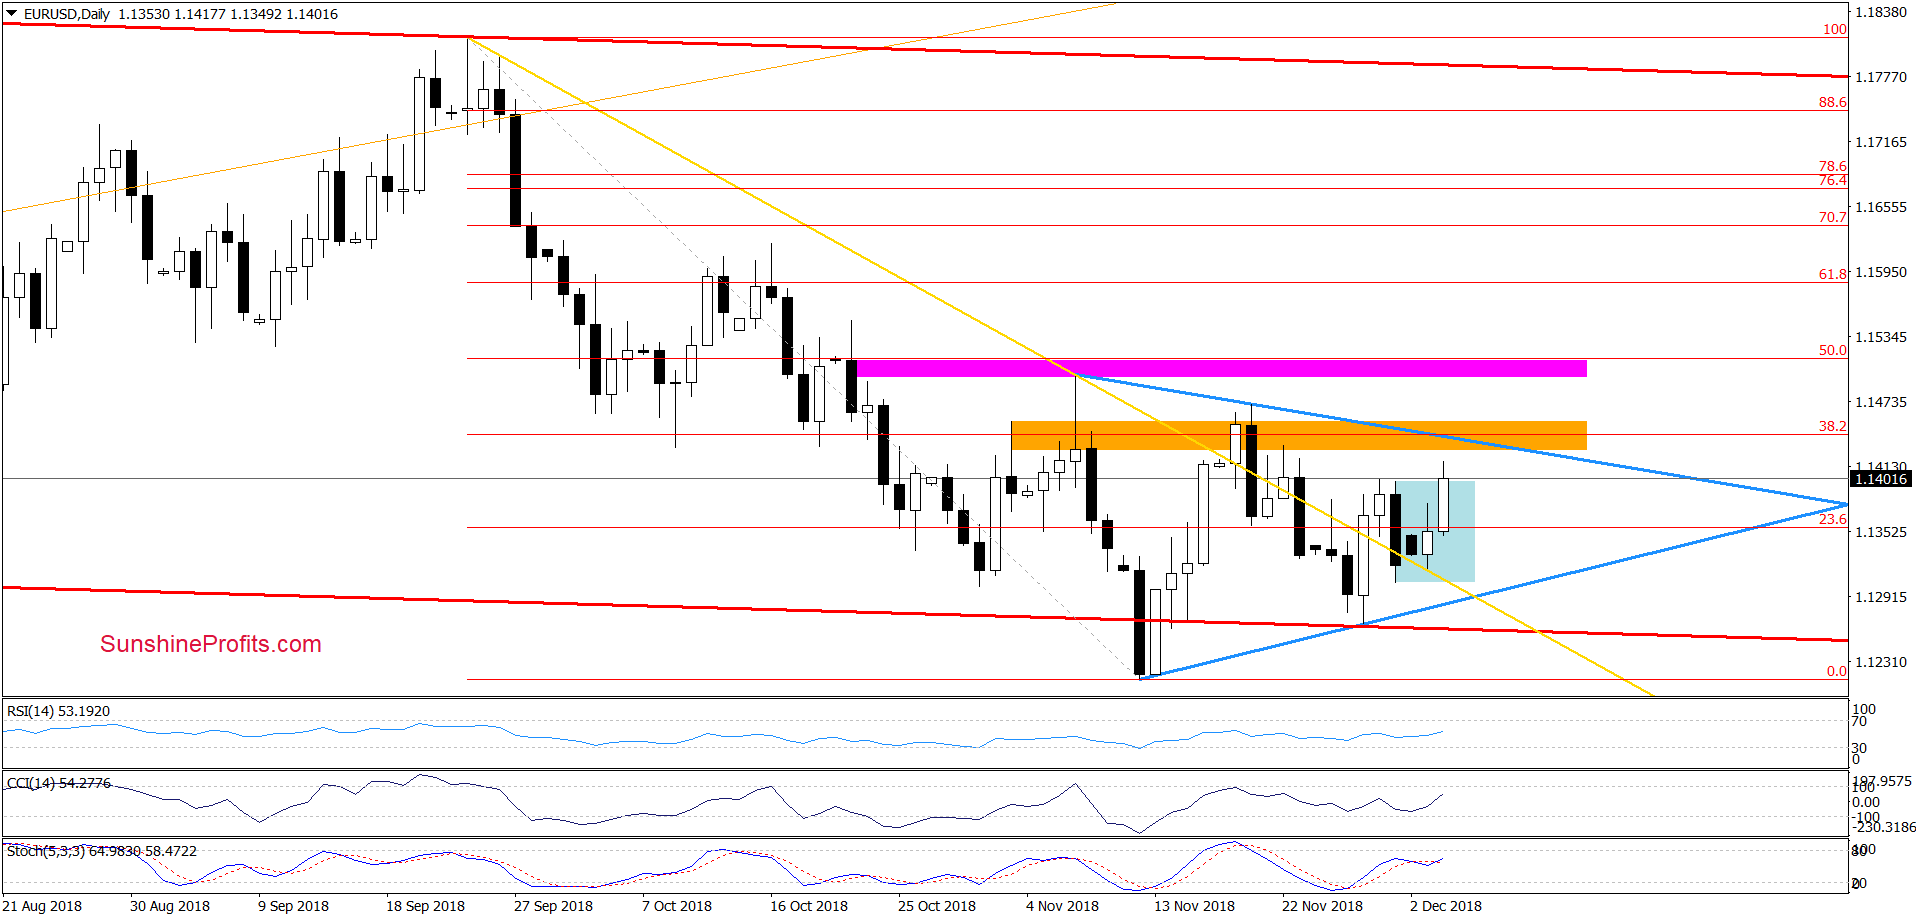
Earlier today, EUR/USD increased above the upper border of the blue consolidation, which increases the probability that we’ll see a test of the nearest resistances: the upper line of the blue triangle and the orange zone based on the 38.3% Fibonacci retracement.
Although today’s price action looks quite encouraging, we continue to believe that as long as there is no breakout above the upper border of the triangle (or a breakdown under the lower line) another bigger move is not likely to be seen and short-lived moves in both directions should not surprise us in the coming days.
Nevertheless, if currency bulls show strength and manage to take the exchange rate above the nearest resistances, we’ll consider opening long positions.
GBP/USD – Double Bottom?
(Click on image to enlarge)
(Click on image to enlarge)
In our last commentary on this currency pair, we wrote that the exchange rate approached this week’s lows and the blue support line (based on the mid-August and late-October lows), which could translate into another upswing in the coming week – especially when we factor in the proximity to and the green support zone marked on the weekly chart below.
(Click on image to enlarge)
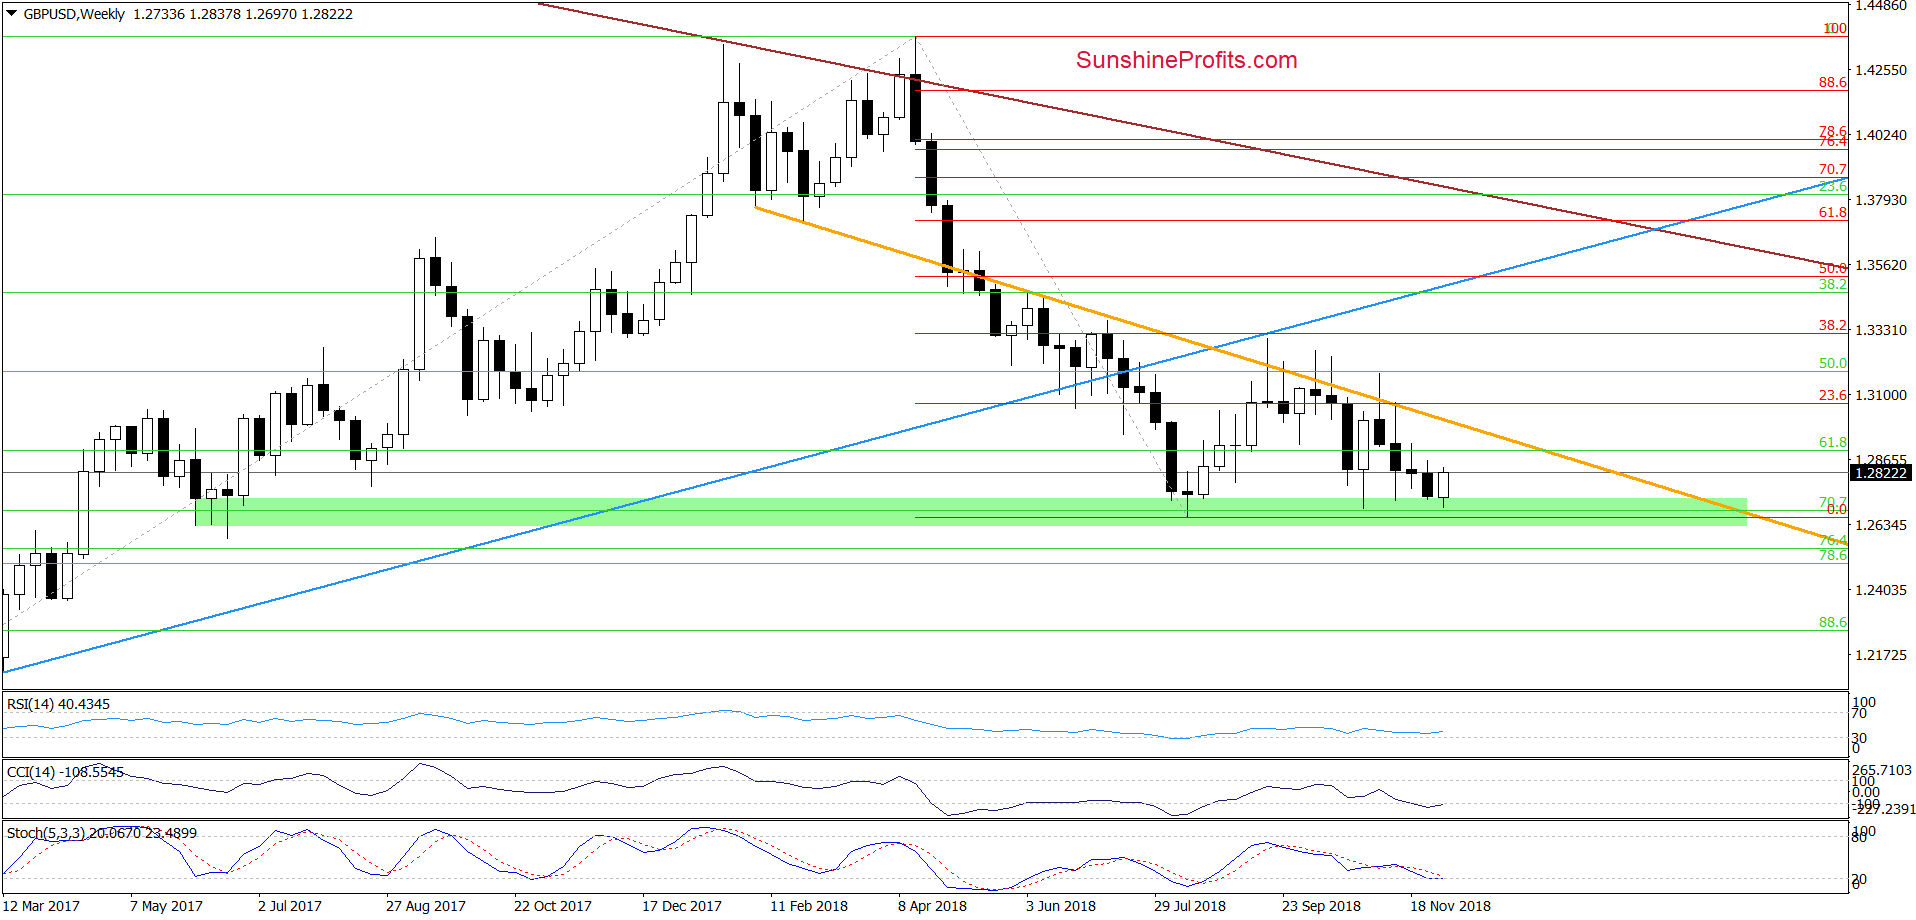
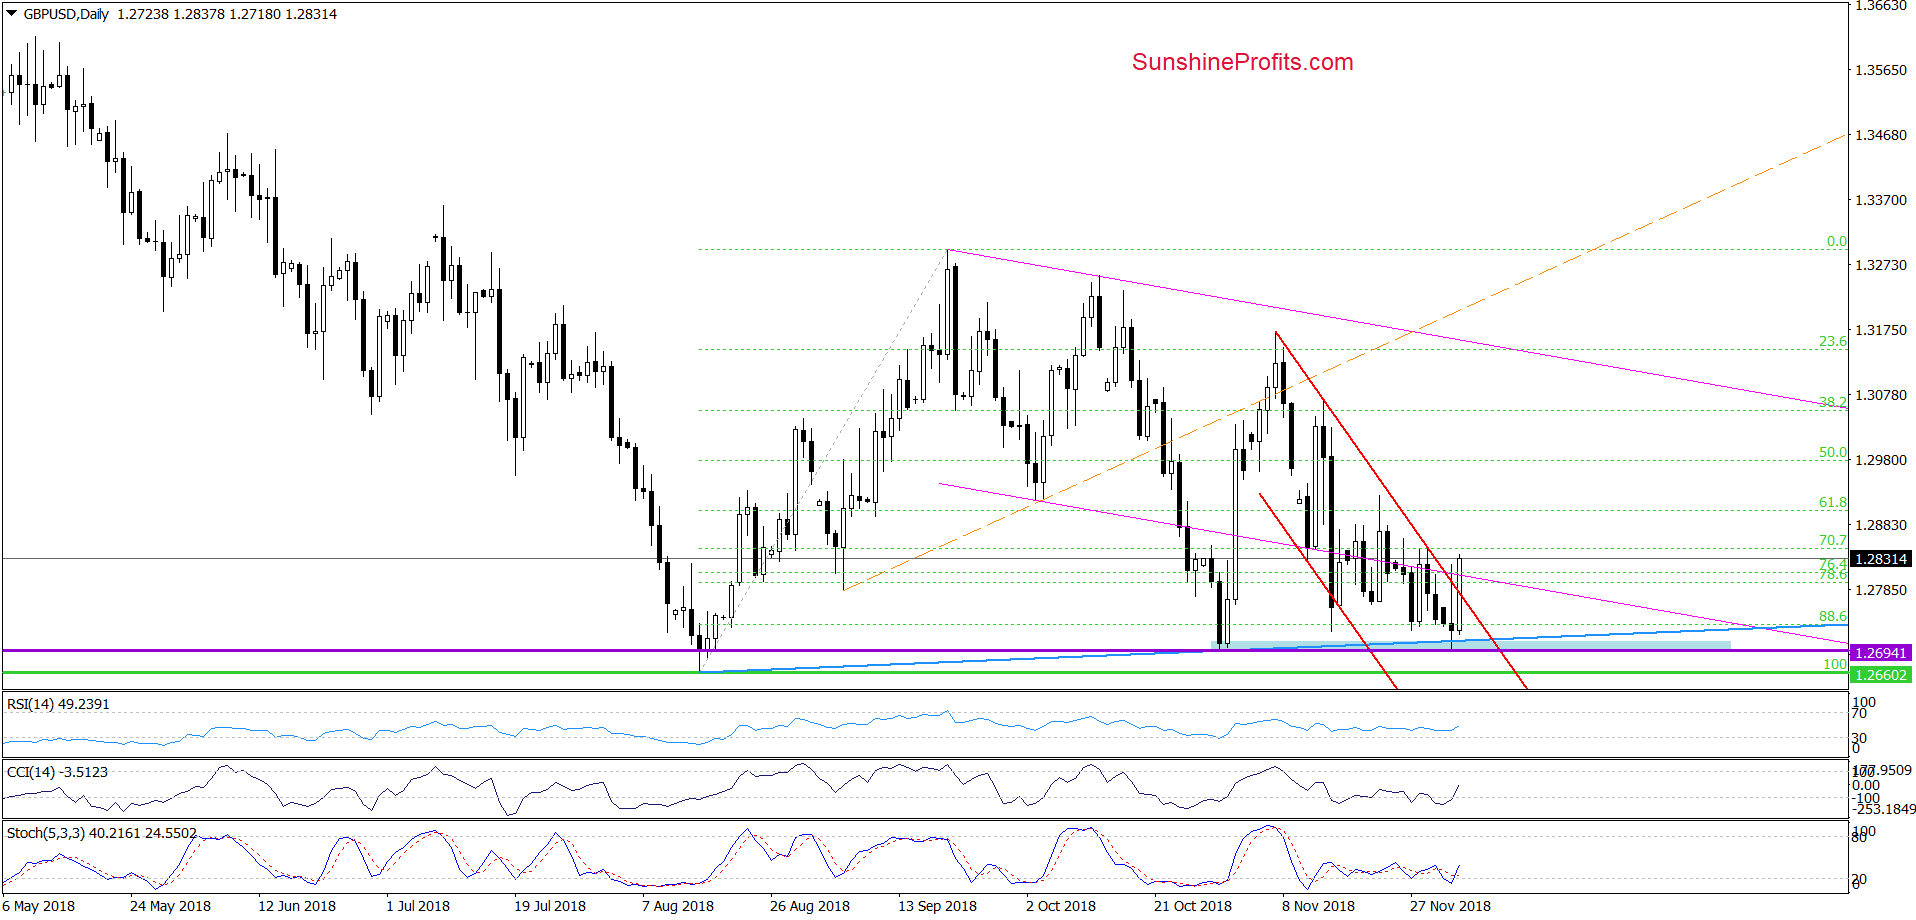
At this point, it is worth noting that this major support area was strong enough to stop the sellers three times in the past, which suggests that as long as there is no successful breakdown below it a bigger move to the downside is not likely to be seen and one more rebound from here should not surprise us.
Nevertheless, in our opinion, a bigger move to the upside will be more likely and reliable if currency bulls manage to take the pair above the upper border of the red declining trend channel marked on the daily chart. If we see such price action, we’ll consider opening long positions.
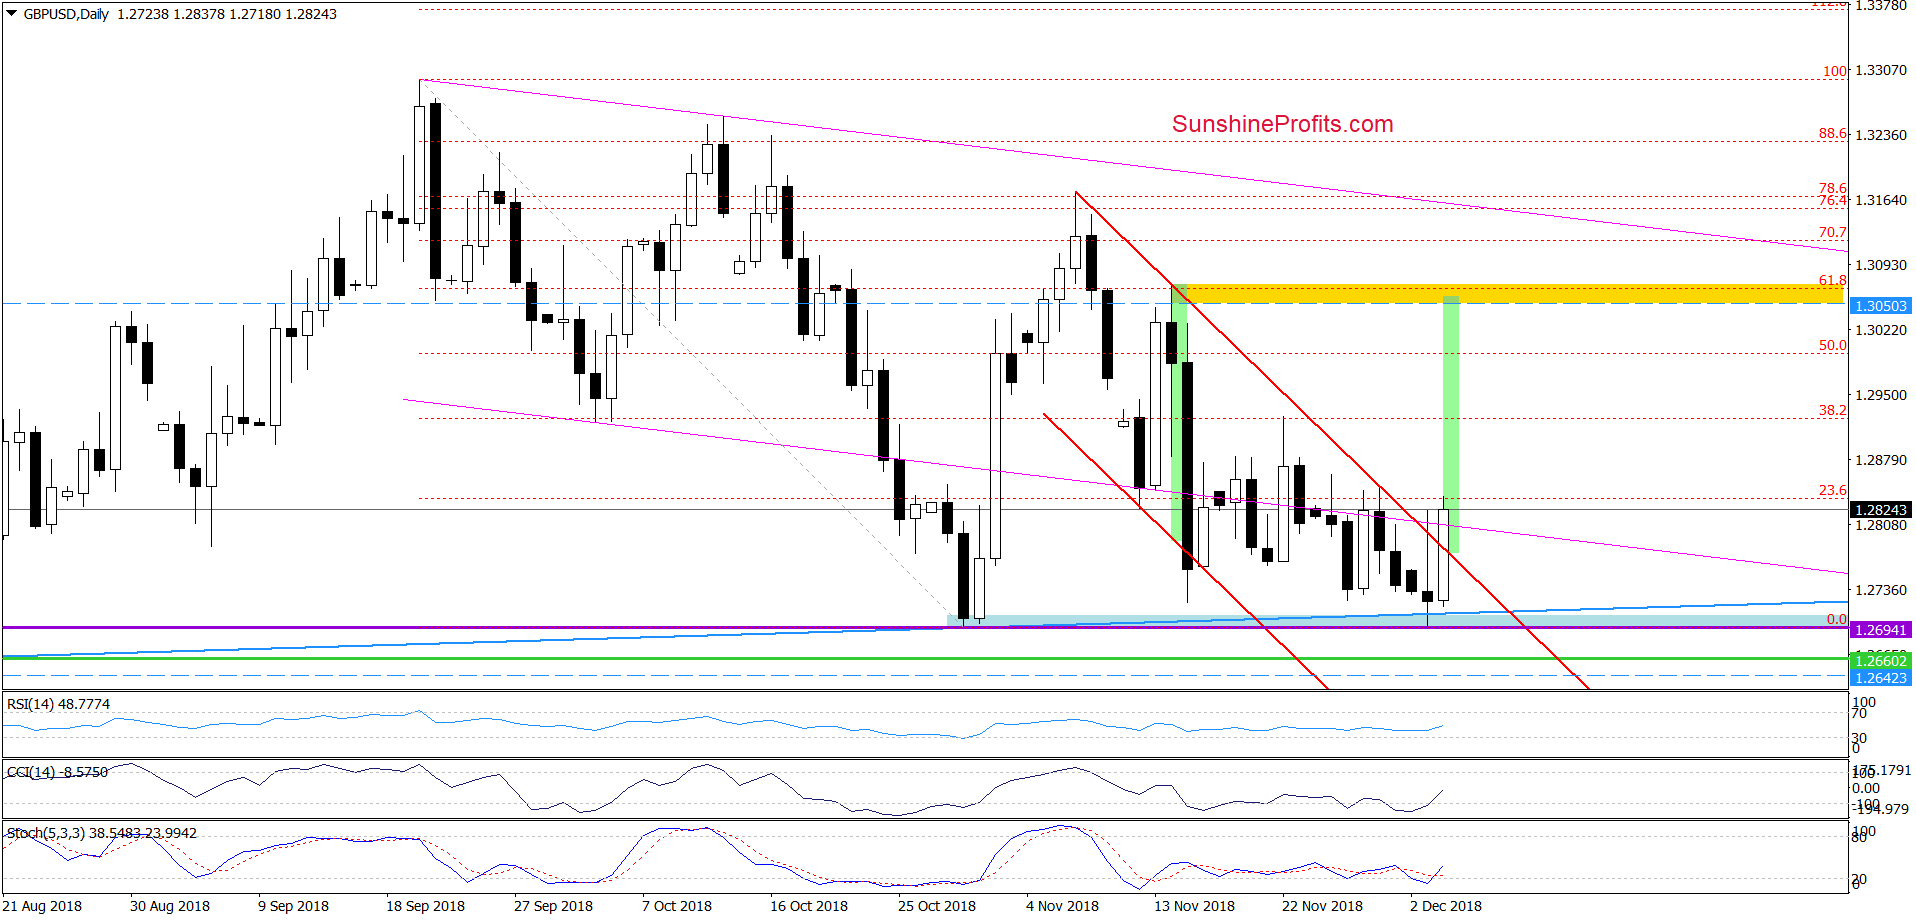
From today’s point of view, we see that the situation developed in tune with the above assumptions and GBP/USD bounced off the blue support zone marked on the daily chart (created by the purple horizontal line based on the late-October low and the above-mentioned medium-term blue support line).
As you see on the daily chart, currency bulls failed to hold the exchange rate above the upper border of the red declining trend channel yesterday, which resulted in a sharp pullback. Despite this deterioration, they didn’t give up and take the pair higher once again during today’s session.
Thanks to this upswing, the exchange rate broke not only above the red trend channel, but also came back into the pink declining trend channel, which in combination with the buy signals generated by the daily indicators suggests further improvement in the very near future – especially if GBP/USD closes today’s session above these lines.
How high could the pair go if we see such price action?
In our opinion, if the exchange rate extended gains from current levels, the next upside target will be the November 22 peak of 1.2925 or even the yellow resistance zone marked on the daily chart. Why there? Because in this area, the size of the upward move will correspond to the height of the red declining trend channel.
Additionally, the pro-growth scenario is also reinforced by the proximity to the above-mentioned green support zone marked on the weekly chart and the buy signals generated by the daily CCI and the Stochastic Oscillator.
USD/JPY – The Breakdown!
(Click on image to enlarge)
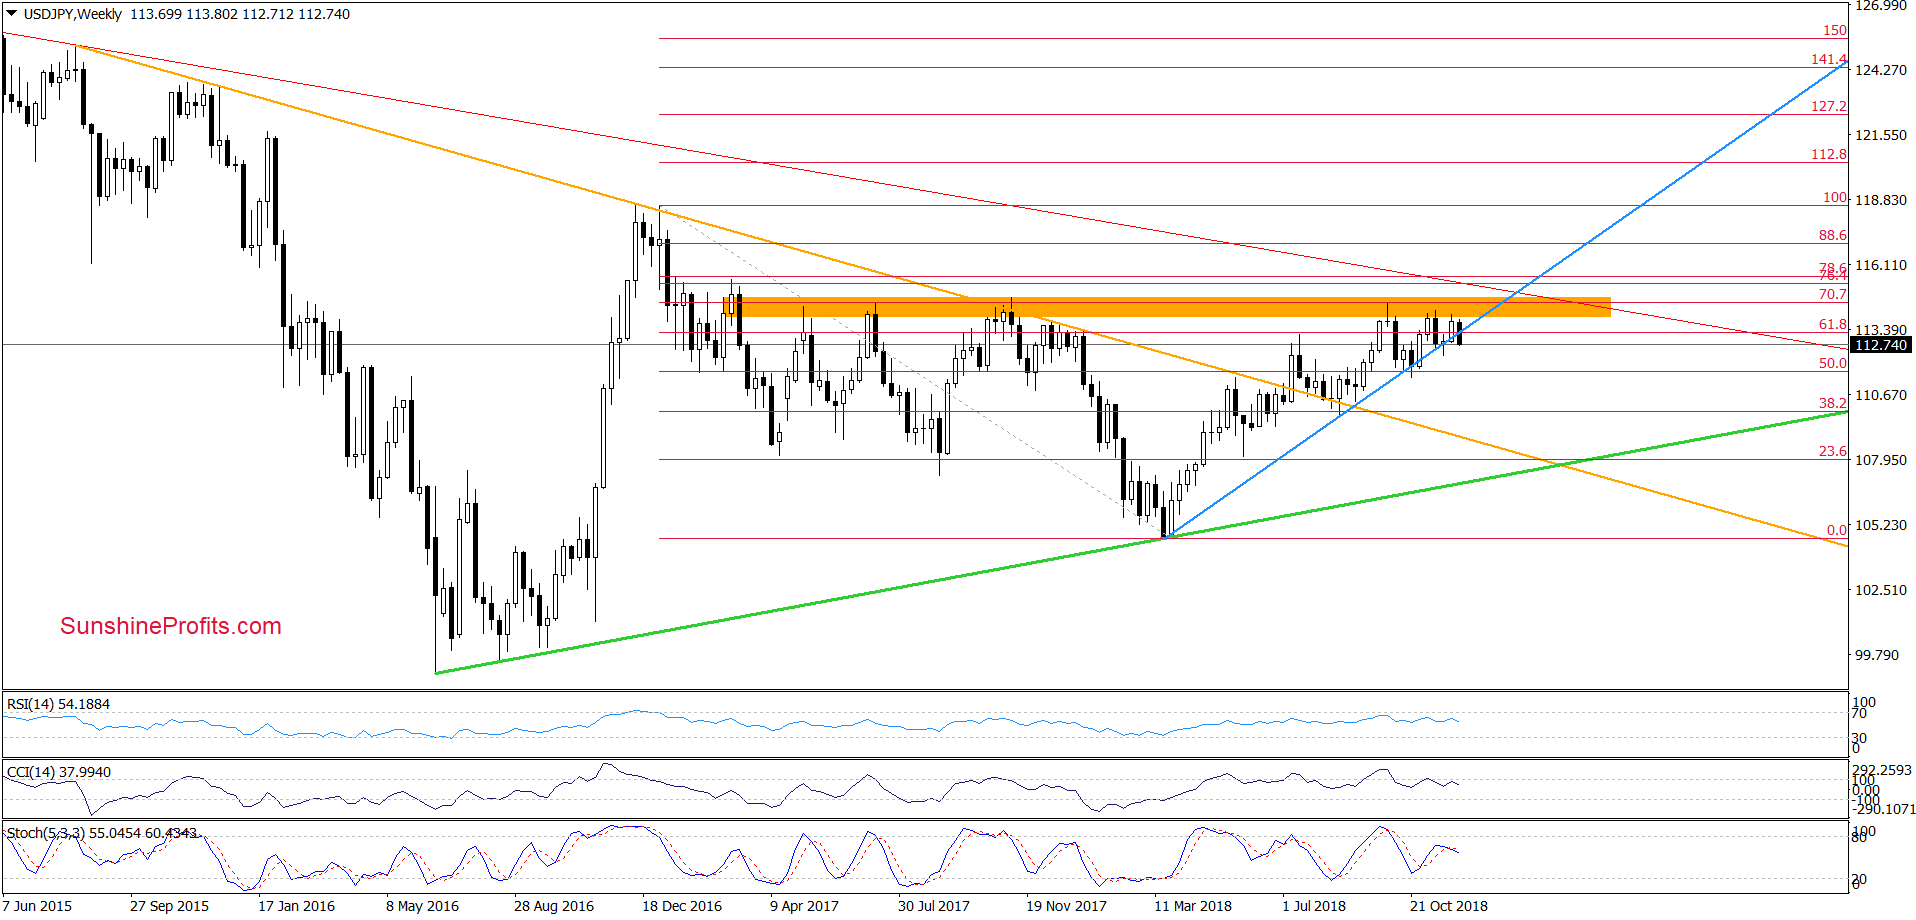
In our yesterday’s alert, we wrote that USD/JPY was trading in a narrow range between the major resistance zone (marked with orange, which continues to keep gains in check since March 2017) and the long-term blue support line based on the March 2018 and August 2018 lows.
Although currency bulls managed to invalidate the earlier tiny breakdowns under this major support line, the orange zone was still in cards, encouraging the sellers to act. Additionally, the current position of the weekly indicators suggested that anther move to the downside was just a matter of time.
From today’s point of view, we see that we did not have to wait long for the effects of this combination. As you can see on the above chart USD/JPY moved sharply lower, breaking below the long-term blue support line once again and making our short positions profitable.
Additionally, the CCI and the Stochastic Oscillator re-generated the sell signals, increasing the probability of further deterioration in the coming week.
How did this price action affect the very short-term picture of the exchange rate?
(Click on image to enlarge)
Before we answer this question, let’s recall what we wrote yesterday:
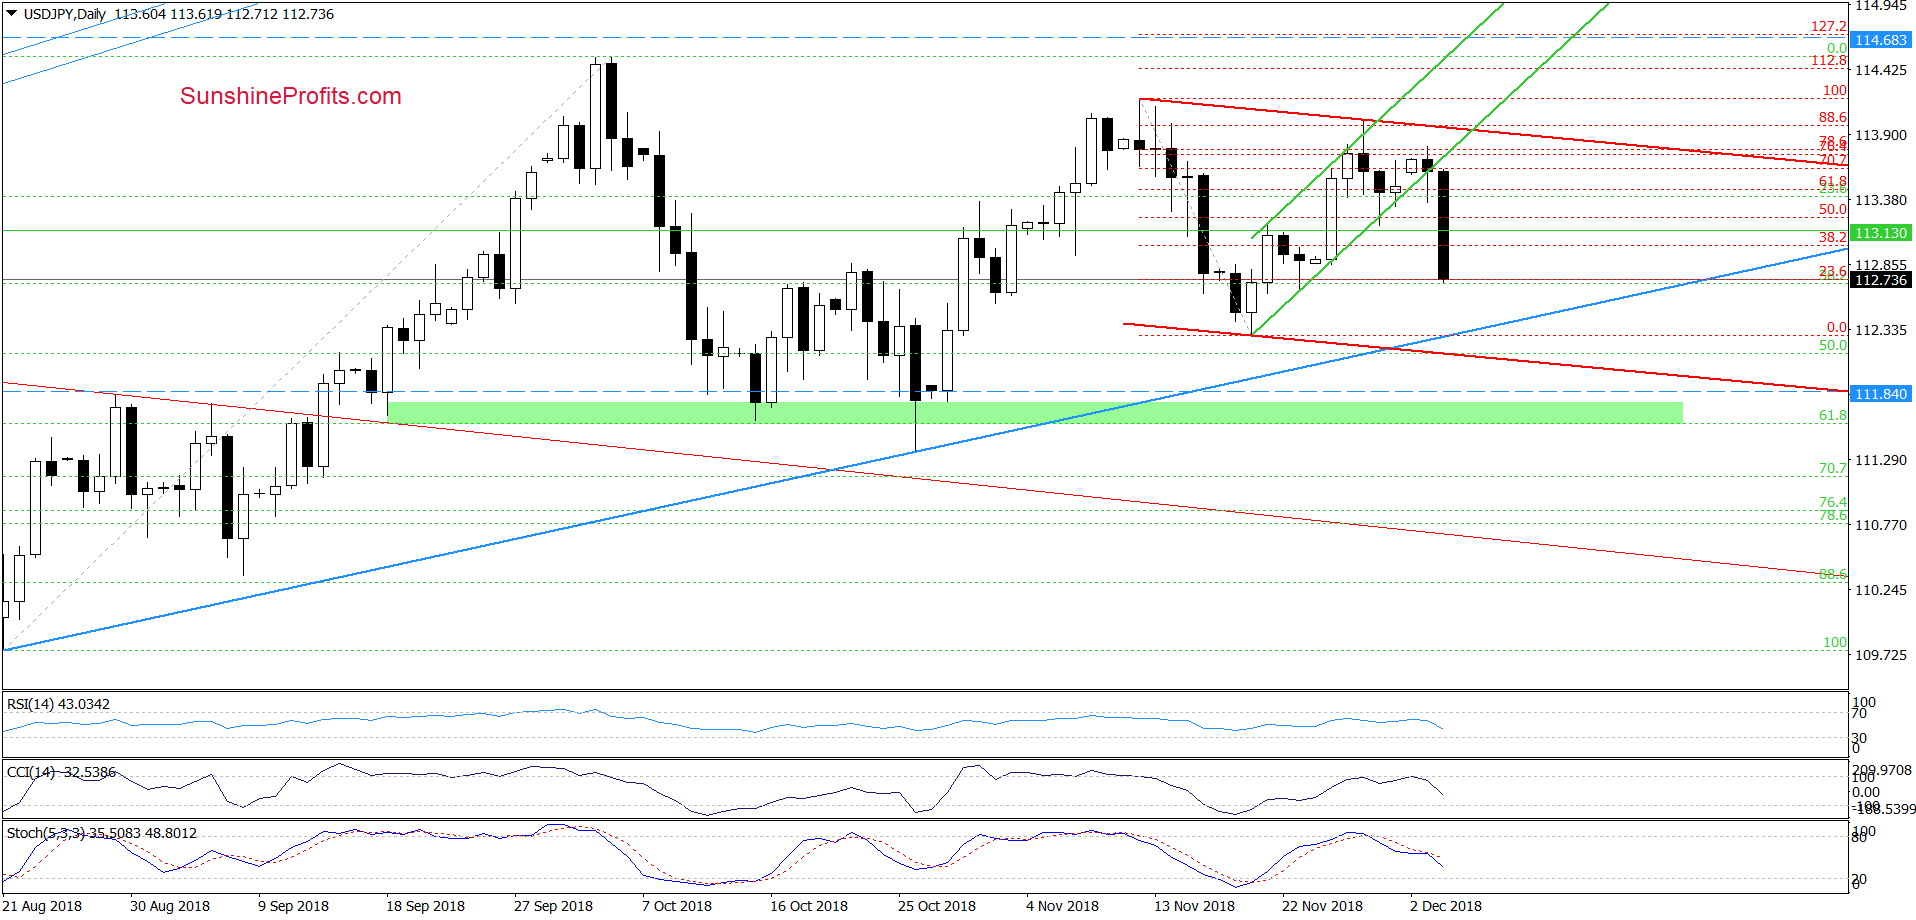
(…) currency bears pushed USD/JPY to the lower border of the green rising trend channel once again (there was even a short-lived decline under this support), which in combination with the sell signals generated by the CCI and the Stochastic Oscillator increases the likelihood of lower values of the exchange rate in the coming days.
As you see, the situation developed in tune, with the above assumptions, which means that we’ll see a realization of the bearish scenario in the very near future:
(…) What could happen if USD/JPY drops below the formation? In our opinion, the sellers will test (at least) the medium-term blue support line based on the August and October lows or even the November 20 low.
Finishing today’s commentary on this currency pair, please note that if the above-mentioned downside target is broken, the sellers will likely test the lower border of the red declining trend channel (currently at around 112.13) or even the green support zone based on the October lows and the 61.8% Fibonacci retracement.
USD/CHF – Third Time Lucky?
(Click on image to enlarge)
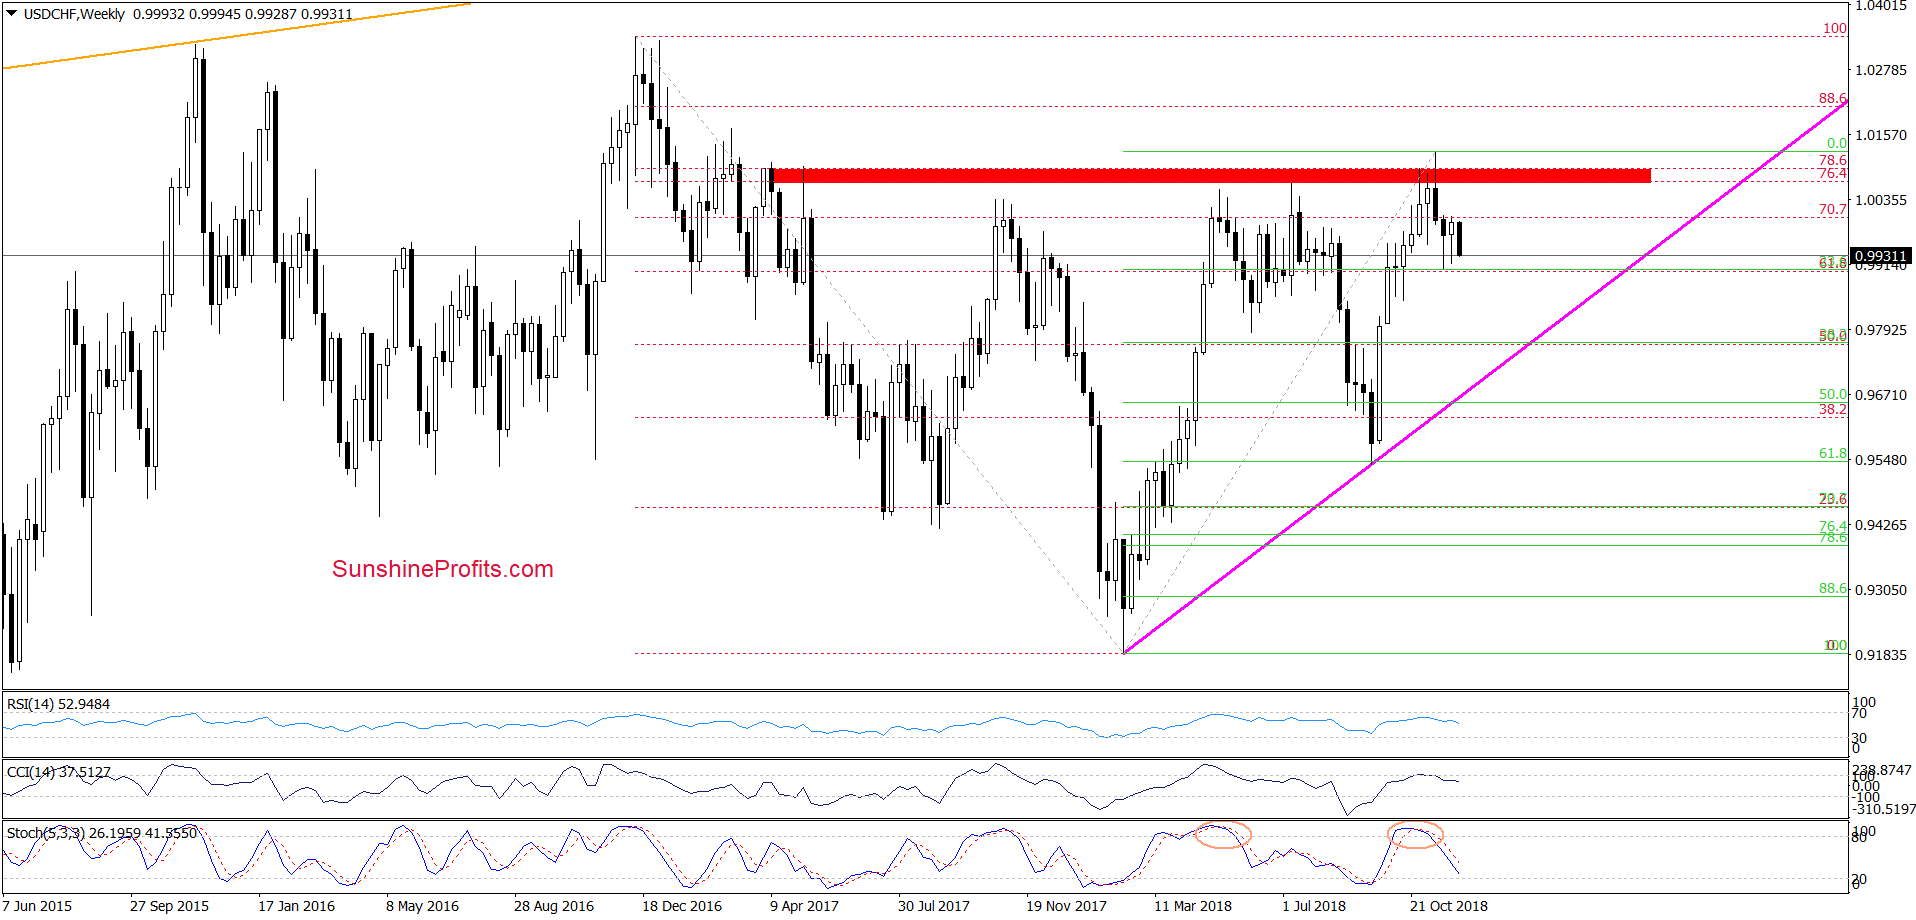
Looking at the weekly chart, we see that the overall situation in the medium term hasn’t changed much as USD/CHF is still trading in a narrow range slightly above the 23.6% Fibonacci retracement based on the entire February-November upward move.
Nevertheless, the sell signals generated by the indicators suggest that lower values of the exchange rate are just around the corner.
Will the short-term picture of the pair confirm this scenario? Let’s examine the daily chart to find out.
(Click on image to enlarge)
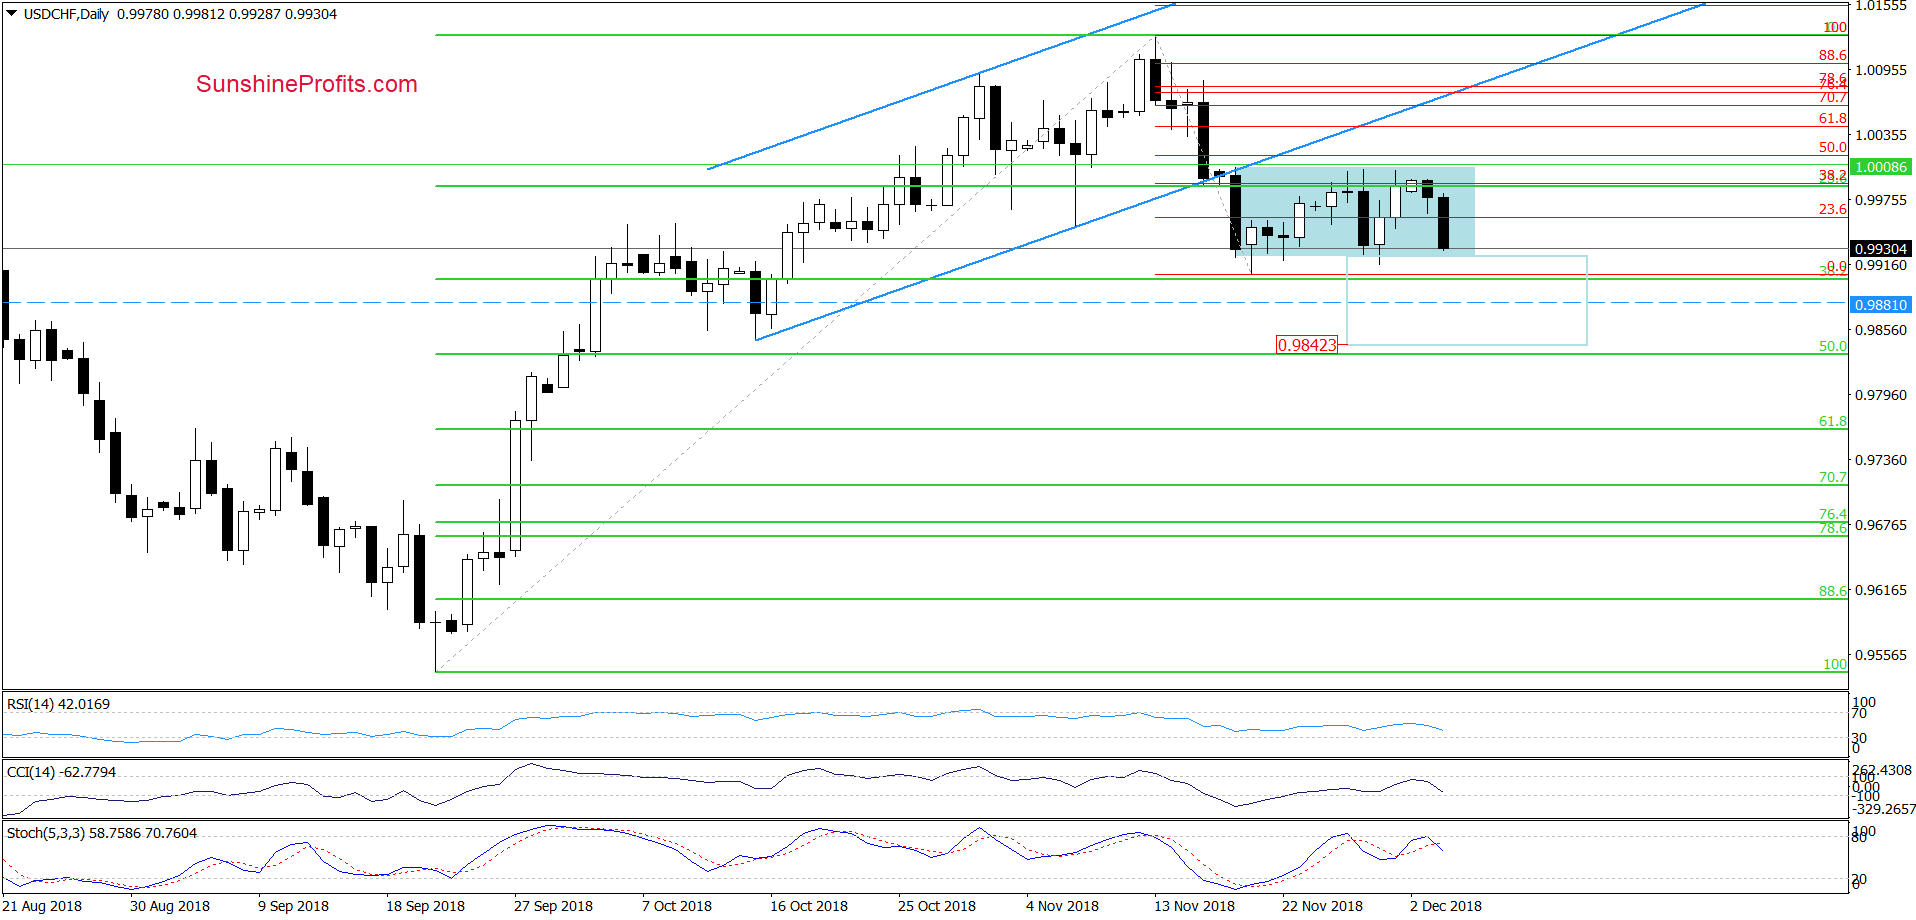
From this perspective, we see that the proximity to the upper border of the blue consolidation (created by an intraday high of the big black candlestick formed on November 19) encouraged currency bears to act once again, which resulted in a quite sharp downswing that erased almost entire recent upward move and made our short positions even more profitable.
Thanks to this drop, USD/CHF approached the lower border of the blue consolidation once again, which suggests that we’ll see at least a test of the 38.2% Fibonacci retracement in the very near future.
As you see on the daily chart, this support (or even a proximity to it) triggered rebounds during recent weeks but taking into account the sell signals re-generated by the daily indicators, it seems that this time currency bears they may be able to break through it.
If they manage to go below the retracement, we’ll likely see a drop to the mid-October lows and the 50% Fibonacci retracement in the following days (around 0.9833-0.9846). At this point, it is also worth noting that in this area the size of the downward move will correspond to the height of the blue consolidation, which increases the probability that the sellers will want to make profits in this area.


