
BEA Revises 4th Quarter 2018 GDP Growth Downward To 2.16%
In their final estimate of the US GDP for the fourth quarter of 2018, the Bureau of Economic Analysis (BEA) reported that the US economy was growing at a +2.16% annual rate, down -0.42 percentage points (pp) from their previous estimate and down -1.20pp from the prior quarter.
The downward revision in the headline number was driven by weaker estimates of the growth in the consumption of consumer goods (down -0.26pp from the previous report), weaker fixed investments (down -0.15pp from the previous report) and governmental spending (down -0.14pp from the previous report). The rest of the revisions were statistical noise, except for an upward +0.11pp revision to imports.
Household disposable income was reported to be up +$391 per annum on a quarter over quarter basis, and the household savings rate was reported to be 6.8% (up +0.4pp from the prior quarter).
For this estimate, the BEA assumed an effective annualized deflator of 1.87%. During the same quarter (October 2018 through December 2018) the inflation recorded by the Bureau of Labor Statistics (BLS) in their CPI-U index was materially smaller at 1.14%. Overestimating inflation results in pessimistic growth rates, and if the BEA's "nominal" data was deflated using CPI-U inflation information the headline growth number would have been significantly higher at a +2.93% annualized growth rate.
Among the notable items in the report :
-- The headline contribution from consumer expenditures for goods was reported to be +0.54%, down -0.26pp from the previous report and down -0.36pp from the prior quarter.
-- The contribution to the headline from consumer spending on services was reported to be +1.12%, up +0.01pp from the previous report, but down -0.35pp from the prior quarter. The combined consumer contribution to the headline number was reported to be down -0.71pp from the prior quarter, marking the second consecutive quarter of weakening growth in consumer spending.
-- The headline number for commercial/private fixed investments was reported to be +0.54%, down -0.15pp from the previous report but still up +0.33pp from the prior quarter.
-- Inventories boosted the headline number by +0.11%, down -2.22pp from the prior quarter. It is important to remember that the BEA's inventory numbers are exceptionally noisy (and susceptible to significant distortions/anomalies caused by commodity pricing or currency swings) while ultimately representing a zero reverting (and long term essentially zero-sum) series.
-- Surprisingly, the growth in governmental spending continued to weaken significantly, reducing the headline number by -0.07% (down -0.14pp from the previous report and -0.51pp from the prior quarter). The bulk of the contraction was in state and local capital expenditures and Federal non-defense spending.
-- The previous estimate's growth in exports was revised upward by another +0.03pp to +0.22%.
-- Imports also strengthened the headline number, improving +0.11pp from the previous report. In aggregate, foreign trade negatively impacted the headline number by only -0.08pp, a full +1.91pp better than 3Q-2018.
-- The annualized growth in the "real final sales of domestic product" dropped to +2.05%, but that was up +1.02pp from the prior quarter. This is the BEA's "bottom line" measurement of the economy (and it excludes the inventory data).
-- As mentioned above, real per-capita annualized disposable income grew by $391 quarter over quarter. The annualized household savings rate was also reported to have increased to 6.8% (up +0.4pp from the prior quarter).
The Numbers, as Revised
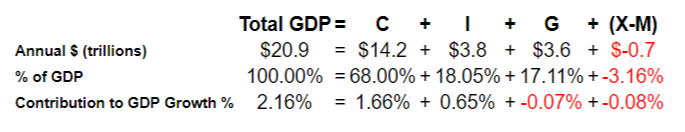
As a quick reminder, the classic definition of the GDP can be summarized with the following equation :
GDP = private consumption + gross private investment + government spending + (exports-imports)
or, as it is commonly expressed in algebraic shorthand :
GDP = C + I + G + (X-M)
In the new report the values for that equation (total dollars, percentage of the total GDP, and contribution to the final percentage growth number) are as follows :
GDP Components Table
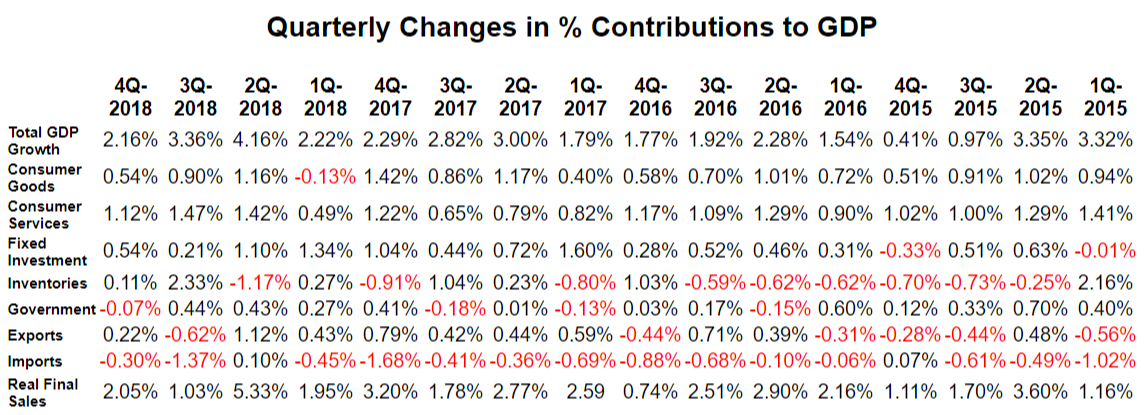
Quarterly Changes in % Contributions to GDPThe quarter-to-quarter changes in the contributions that various components make to the overall GDP can be best understood from the table below, which breaks out the component contributions in more detail and over time. In the table below we have split the "C" component into goods and services, split the "I" component into fixed investment and inventories, separated exports from imports, added a line for the BEA's "Real Final Sales of Domestic Product" and listed the quarters in columns with the most current to the left:
Summary and Commentary
This final report for the 4th quarter of 2018 has a couple of interesting twists :
-- The net headline number was revised lower to the very near the bottom of the "Goldilocks" zone. This report, in itself, can't justify a change in Federal Reserve monetary policy in any direction. But at the same time, it is clearly signaling an economy where the growth cycle probably peaked several quarters ago.
-- That said, a deeper dive into the numbers reveals a second consecutive quarter of weakening growth in consumer spending. And the increase in the household savings rate explains to a large extent where any additional disposable income is actually going -- into savings in lieu of spending.
-- The contraction in Governmental spending is puzzling -- until one considers the Federal budgetary shenanigans at the end of the prior fiscal year (bringing spending forward at the end of the third calendar quarter). But state and local spending for capital improvements also weakened, and it is hard to blame Washington bureaucrats for that particular turn of events.
The BEA's data collection process is massive, cumbersome and prone to extensive revisions down the road. It is not a particularly good real-time gauge for what is happening in the economy -- especially at times when the economy is in transition. The first quarter of 2008 was a good example of that, and the BEA took over five years to get that number right:
BEA's Official and Changing View of First Quarter 2008 GDP
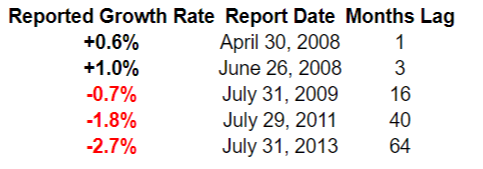
We would certainly be cautious when reading today's report. And we would also be paying attention to other reports that give clearer signals when the economy is beginning a transition.
Disclosure: None.


