
BEA Revises 1st Quarter 2019 GDP Growth Slightly Downward To 3.07%
In their second estimate of the US GDP for the first quarter of 2019, the Bureau of Economic Analysis (BEA) reported that the US economy was growing at a +3.07% annual rate, down -0.11 percentage points (pp) from the previous report, but still up +0.91pp from the prior quarter.
The details within the revisions should be viewed as merely statistical noise. Consumer spending on goods is still reported to be contracting, while the growth rates for fixed investments and inventories were revised modestly lower. Export and Import growth rates had minor and largely offsetting revisions.
Household disposable income was revised lower by -$132 per annum on a quarter over quarter basis, and the household savings rate was reported to have dropped down to 6.7% (down +0.3pp from the previous report).
For this estimate, the BEA assumed an effective annualized deflator of 0.48%. During the same quarter (January 2019 through March 2019) the inflation recorded by the Bureau of Labor Statistics (BLS) in their CPI-U index was materially higher at 2.27%. Underestimating inflation results in optimistic growth rates, and if the BEA's "nominal" data was deflated using CPI-U inflation information the headline growth number would have been more than halved to a +1.29% annualized growth rate.
Among the notable items in the report :
-- The new report confirmed that consumer spending for goods contracted during the first quarter of 2019. The headline contribution from consumer goods spending was reported to be -0.06%, down -0.60pp from the prior quarter.
-- The contribution to the headline from consumer spending on services was reported to be unchanged at +0.96%, down -0.16pp from the prior quarter. The combined consumer contribution to the headline number was reported to be down -0.76pp from the prior quarter, confirming a third consecutive quarter of weakening growth in consumer spending.
-- The headline contribution for commercial/private fixed investments was reported to be +0.18%, down -0.09pp from the previous report and now down -0.36pp from the prior quarter.
-- Inventories boosted the headline number by +0.60pp, down -0.05pp from the previous report but up +0.49pp from the prior quarter. It is important to remember that the BEA's inventory numbers are exceptionally noisy (and susceptible to significant distortions/anomalies caused by commodity pricing or currency swings) while ultimately representing a zero reverting (and long term essentially zero-sum) series.
-- The growth rate in governmental spending was left essentially unchanged at +0.42%, up +0.49pp from the prior quarter.
-- The annualized growth in exports was reported to be +0.58%, now up +0.36pp from the prior quarter.
-- In the first quarter imports added +0.39% annualized "growth" to the headline number (after subtracting -0.30% annualized "growth" during the prior quarter). As mentioned previously this amounts to economic "growth" by virtue of fewer dollars spent on imported goods.
-- The annualized growth in the "real final sales of domestic product" was revised modestly downward to +2.47%, but it is still up +0.42pp from the prior quarter. This is the BEA's "bottom line" measurement of the economy (and it excludes the inventory data).
-- As mentioned above, the growth of real per-capita annualized disposable income was revised downward to $132 quarter over quarter. The annualized household savings rate was reported to have decreased to 6.7% (up +0.2pp from the prior quarter).
The Numbers, as Revised
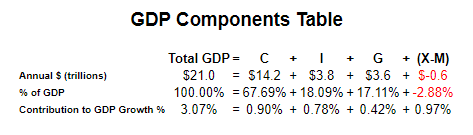
As a quick reminder, the classic definition of the GDP can be summarized with the following equation :
GDP = private consumption + gross private investment + government spending + (exports - imports)
or, as it is commonly expressed in algebraic shorthand :
GDP = C + I + G + (X-M)
In the new report the values for that equation (total dollars, percentage of the total GDP, and contribution to the final percentage growth number) are as follows :
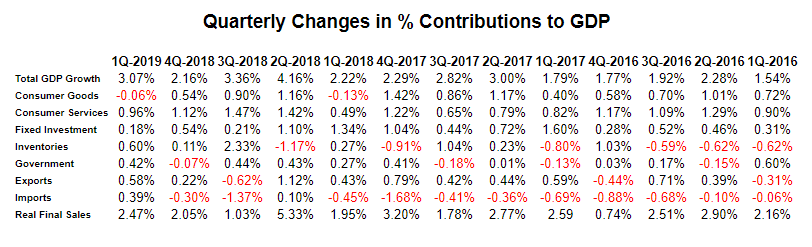
The quarter-to-quarter changes in the contributions that various components make to the overall GDP can be best understood from the table below, which breaks out the component contributions in more detail and over time. In the table below we have split the "C" component into goods and services, split the "I" component into fixed investment and inventories, separated exports from imports, added a line for the BEA's "Real Final Sales of Domestic Product" and listed the quarters in columns with the most current to the left :
Summary and Commentary
Several key points can be taken from this revision for the 1st quarter of 2019 :
-- The BEA confirmed that consumer spending on goods contracted. The relatively soft growth in consumer spending on services was left unchanged.
-- The annualized growth in commercial and private fixed investments more than halved relative to the prior quarter.
-- Imports added +0.39% annualized growth to the headline, even though it actually reflects softening import spending in the midst of generally weaker global trade.
-- All of this still left the headline number in the "Goldilocks" zone of economic growth.
The question remains: Are these fair skies a sign of a well-oiled and unstoppable economy? Or is this merely the calm before the next storm?
Disclosure: None.


