
BEA Reports That Third Quarter 2019 GDP Grew At A 1.93% Rate
In their first (preliminary) estimate of the US GDP for the third quarter of 2019, the Bureau of Economic Analysis (BEA) reported that the US economy was growing at a +1.93% annual rate, down -0.08 percentage points (pp) from the prior quarter.
The minor change in the headline masked a material weakening in the growth of consumer spending. The growth rate for aggregate consumer spending on goods and services was reported to be over 1% lower (-1.10pp) than in the prior quarter. The growth of governmental spending (Federal, state and local) also weakened by about half of that amount. But largely offsetting those negative impacts on the headline number were soaring inventories and exports.
Annualized household disposable income was reported to be $253 higher than in the prior quarter, and the household savings rate was reported to be 8.1%, up 0.1pp from the prior quarter.
For this estimate, the BEA assumed an effective annualized deflator of 1.56%. During the same quarter, the inflation recorded by the Bureau of Labor Statistics (BLS) in their CPI-U index was slightly higher at 1.66%. Underestimating inflation results in optimistic growth rates, and if the BEA's nominal data was deflated using CPI-U inflation information the headline growth number would have been 1.86%.
Among the notable items in the report :
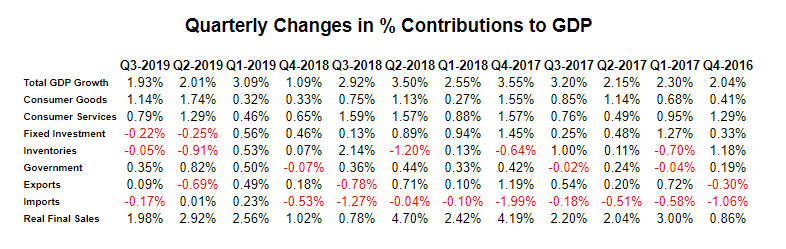
-- Consumer spending for goods was reported to be growing at a 1.14% rate, down -0.60pp from the prior quarter.
-- The contribution to the headline from consumer spending on services was reported to be 0.79%, down -0.50pp from the prior quarter. The combined consumer contribution to the headline number was 1.93%, down -1.10pp from the prior quarter.
-- The headline contribution for commercial/private fixed investments was reported to be -0.22%, up 0.03pp from the prior quarter.
-- Inventories subtracted -0.05% from the headline number, up 0.86pp from the prior quarter. It is important to remember that the BEA's inventory numbers are exceptionally noisy (and susceptible to significant distortions/anomalies caused by commodity pricing or currency swings) while ultimately representing a zero reverting (and long term essentially zero sum) series.
-- The contribution to the headline from governmental spending was reported to be 0.35%, down -0.47pp from the prior quarter.
-- The contribution from exports was reported to be 0.09%, up 0.78pp from the prior quarter.
-- Imports subtracted -0.17% annualized 'growth' from the headline number, down -0.18pp from the prior quarter. Foreign trade contributed a net -0.08pp to the headline number.
-- The annualized growth in the 'real final sales of domestic product' was reported to be 1.98%, down -0.94pp from the prior quarter. This is the BEA's 'bottom line' measurement of the economy (and it excludes the inventory data).
-- As mentioned above, real per-capita annualized disposable income was reported to have increased by $253 quarter to quarter. The annualized household savings rate was 8.1% (up 0.1pp from the prior quarter). In the 45 quarters since 2Q-2008, the cumulative annualized growth rate for real per-capita disposable income has been 1.50%.
The Numbers
As a quick reminder, the classic definition of the GDP can be summarized with the following equation :
GDP = private consumption + gross private investment + government spending + (exports - imports)
or, as it is commonly expressed in algebraic shorthand :
GDP = C + I + G + (X-M)
In the new report the values for that equation (total dollars, percentage of the total GDP, and contribution to the final percentage growth number) are as follows :
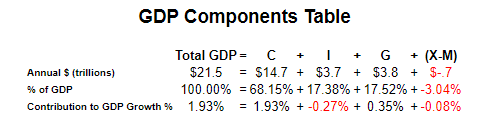
The quarter-to-quarter changes in the contributions that various components make to the overall GDP can be best understood from the table below, which breaks out the component contributions in more detail and over time. In the table below we have split the "C" component into goods and services, split the "I" component into fixed investment and inventories, separated exports from imports, added a line for the BEA's "Real Final Sales of Domestic Product" and listed the quarters in columns with the most current to the left :
Summary and Commentary
Although the headline number did not change significantly from quarter to quarter, there are items of concern in this new report:
-- The headline number was rescued by exports and inventory growth -- two of the BEA's most volatile line items -- which do not reflect domestic consumption.
-- The previously greater than +3% growth in consumer spending for goods and services weakened materially.
-- The softening consumer spending is going into increased household savings -- ahead of the Q4 holiday spending cycle.
-- Inventory changes went from a strong draw-down to a nearly neutral reading, indicating that although retailers are no longer clearing stock, they remain cautious about the highly anticipated holiday spending.
-- And the BEA's own "bottom line" measurement of economic growth ("Real Final Sales") weakened by nearly a full percent (-0.94pp).
We have always thought that "Fear, Uncertainty and Doubt" ("FUD") can be as much of a factor in consumer spending rates as horrendous weather. And if the cause of the FUD is entrenched politicians, the FUD can certainly last much longer than a cold snap or the entire hurricane season. It will be interesting to see how the economy weathers the ongoing storms in Washington.
Disclosure: None.


