
BEA Reports That Fourth Quarter 2019 GDP Grew At A 2.08% Rate
In their first (preliminary) estimate of the US GDP for the fourth quarter of 2019, the Bureau of Economic Analysis (BEA) reported that the US economy was growing at a +2.08% annual rate, down -0.01 percentage points (pp) from the prior quarter.
This is one of the more misleading headline numbers we have ever seen. It simply does not reflect the overall weakness in the data. The key growth of consumer spending was down nearly a full percentage point (-0.91pp) from the prior quarter. Commercial and private fixed investments were stagnant, and inventories were being allowed to contract. The healthy headline number is generated almost entirely from a huge uptick in imports 'growth' and an implausibly low inflation deflator.
Annualized household disposable income was reported to be $111 higher than in the prior quarter, and the household savings rate was reported to be 7.7%, down -0.1pp from the prior quarter.
For this estimate, the BEA assumed an effective annualized deflator of 1.50%. During the same quarter, the inflation recorded by the Bureau of Labor Statistics (BLS) in their CPI-U index was significantly higher at 3.39%. Underestimating inflation results in optimistic growth rates, and if the BEA's nominal data was deflated using CPI-U inflation information the headline growth number would have been a minuscule 0.22%.
Among the notable items in the report :
-- Consumer spending for goods was reported to be growing at a 0.26% rate, down -0.83pp from the prior quarter.
-- The contribution to the headline from consumer spending on services was reported to be 0.94%, down -0.08pp from the prior quarter. The combined consumer contribution to the headline number was 1.20%, down -0.91pp from the prior quarter.
-- The headline contribution for commercial/private fixed investments was reported to be 0.01%, up 0.15pp from the prior quarter.
-- Inventories subtracted -1.09% from the headline number, down -1.06pp from the prior quarter. It is important to remember that the BEA's inventory numbers are exceptionally noisy (and susceptible to significant distortions/anomalies caused by commodity pricing or currency swings) while ultimately representing a zero reverting (and long term essentially zero sum) series.
-- The contribution to the headline from governmental spending was reported to be 0.47%, up 0.17pp from the prior quarter. That growth was evenly split between Federal and state or local spending.
-- The contribution from exports was reported to be 0.17%, up 0.06pp from the prior quarter.
-- Imports added 1.32% annualized 'growth' to the headline number, up 1.58pp from the prior quarter. Note that in the BEA's calculation matrix the consumption of imports subtracts from domestic production, and 'growth' in this line actually reflects either foreign exchange swings or weakening domestic demand for foreign goods. In aggregate, foreign trade contributed a net 1.49pp to the headline number.
-- The annualized growth in the 'real final sales of domestic product' was reported to be 3.17%, up 1.05pp from the prior quarter. This is the BEA's 'bottom line' measurement of the economy (and it excludes the inventory data).
-- As mentioned above, real per-capita annualized disposable income was reported to have increased by $111 quarter to quarter. The annualized household savings rate was 7.7% (down -0.1pp from the prior quarter). In the 46 quarters since 2Q-2008, the cumulative annualized growth rate for real per-capita disposable income has been 1.50%.
The Numbers
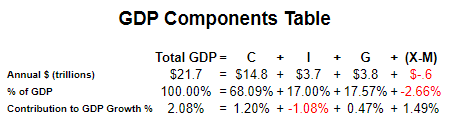
As a quick reminder, the classic definition of the GDP can be summarized with the following equation :
GDP = private consumption + gross private investment + government spending + (exports - imports)
or, as it is commonly expressed in algebraic shorthand :
GDP = C + I + G + (X-M)
In the new report the values for that equation (total dollars, percentage of the total GDP, and contribution to the final percentage growth number) are as follows :
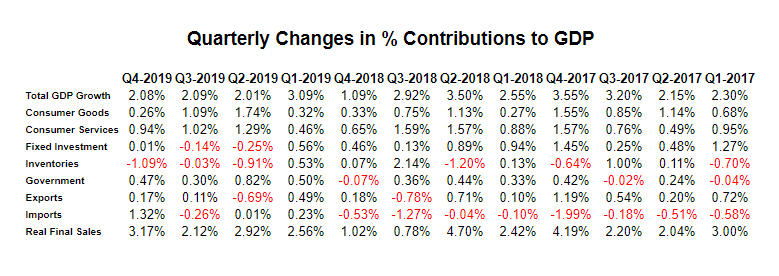
The quarter-to-quarter changes in the contributions that various components make to the overall GDP can be best understood from the table below, which breaks out the component contributions in more detail and over time. In the table below we have split the "C" component into goods and services, split the "I" component into fixed investment and inventories, separated exports from imports, added a line for the BEA's "Real Final Sales of Domestic Product" and listed the quarters in columns with the most current to the left :
Summary and Commentary
Some people will take the BEA's "bottom line" number from the report (their "Real Final Sales of Domestic Product") at it's very attractive face value of +3.17% growth. If so, they will be seriously misled. Sadly the key points of this report can be summarized as follows:
-- Correcting for inflation using data from the Bureau of Labor Statistics gives us a headline of only +0.22% growth.
-- The headline was supported by a huge swing in imports -- which in the BEA's calculation matrix actually results from weakened (exchange rate adjusted) domestic demand for foreign goods.
-- Inventories can contract for one of two reasons: either companies can't keep up with demand, or they are allowing inventories to contract because of lower demand. Unfortunately, the consumer and commercial spending lines tell us that the latter seems far more plausible.
Neither consumers or fixed investments are driving the headline number. Because of that, the cosmetics of this report are far more glamorous than the reality would suggest.
Disclosure: None.


