
BEA Leaves Second Quarter 2019 GDP Growth Essentially Unchanged At 2.04%
In their second estimate of the US GDP for the second quarter of 2019, the Bureau of Economic Analysis (BEA) reported that the US economy was growing at a +2.04% annual rate, down -0.01 percentage points (pp) from their previous estimate and down -1.05pp from the prior quarter.
Although the headline number was essentially unchanged, the report did shift material portions of the aggregate growth into the consumer sector from commercial and governmental activities. Specifically, in the consumer sector spending on goods was revised upward by +0.11pp, while spending on services was revised upward by +0.15pp. Offsetting those improvements, the growth rates for spending on fixed commercial investments, inventories, government, and exports dropped a combined -0.27pp.
Annualized household disposable income was revised $9 higher than in the previous report, and the household savings rate was reported to be 8.0%, down -0.1pp from the previous report.
For this estimate, the BEA assumed an effective annualized deflator of 2.54%. During the same quarter, the inflation recorded by the Bureau of Labor Statistics (BLS) in their CPI-U index was significantly lower at 1.83%. Overestimating inflation results in pessimistic growth rates, and if the BEA's nominal data was deflated using CPI-U inflation information the headline growth number would have been noticeably higher at 2.80%.
Among the notable items in the report :
-- Consumer spending for goods was reported to be growing at a 1.78% rate, up 0.11pp from the previous estimate and up 1.46pp from the prior quarter.
-- The contribution to the headline from consumer spending on services was reported to be 1.32%, up 0.15pp from the previous report and up 0.86pp from the prior quarter. The combined consumer contribution to the headline number was 3.10%, up 0.26pp from the previous report.
-- The headline contribution for commercial/private fixed investments was revised downward to -0.20%, down -0.06pp from the previous report and down -0.76pp from the prior quarter.
-- Inventories subtracted -0.91% from the headline number, down -0.05pp from the previous report and down -1.44pp from the prior quarter. It is important to remember that the BEA's inventory numbers are exceptionally noisy (and susceptible to significant distortions/anomalies caused by commodity pricing or currency swings) while ultimately representing a zero reverting (and long term essentially zero sum) series.
-- The contribution to the headline from governmental spending was revised to 0.77%, down -0.08pp from the previous report but still up 0.27pp from the prior quarter.
-- The contribution from exports was revised to -0.71%, down -0.08pp from the previous report and down -1.20pp from the prior quarter.
-- Imports were left unchanged -- subtracting -0.01% annualized 'growth' from the headline number and down -0.24pp from the prior quarter. Foreign trade contributed a net -0.72pp to the headline number.
-- The annualized growth in the 'real final sales of domestic product' was revised to 2.95%, up 0.04pp from the previous report and up 0.39pp from the prior quarter. This is the BEA's 'bottom line' measurement of the economy (and it excludes the inventory data).
-- As mentioned above, real per-capita annualized disposable income was revised $9 higher than in the previous estimate. The annualized household savings rate was 8.0% (down -0.1pp from the previous report). In the 44 quarters since 2Q-2008, the cumulative annualized growth rate for real per-capita disposable income has been 1.49%.
The Numbers -- As Revised
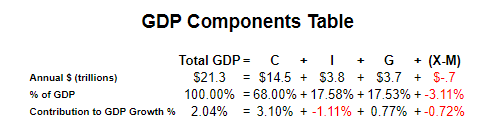
As a quick reminder, the classic definition of the GDP can be summarized with the following equation :
GDP = private consumption + gross private investment + government spending + (exports - imports)
or, as it is commonly expressed in algebraic shorthand :
GDP = C + I + G + (X-M)
In the new report the values for that equation (total dollars, percentage of the total GDP, and contribution to the final percentage growth number) are as follows :
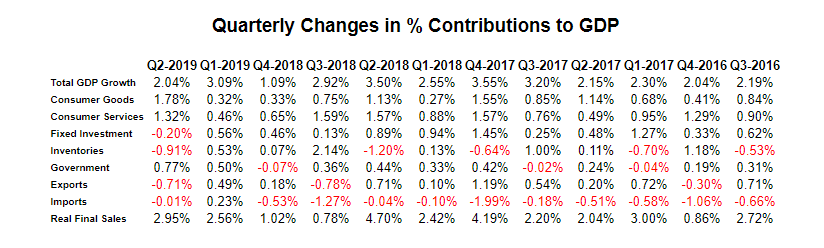
The quarter-to-quarter changes in the contributions that various components make to the overall GDP can be best understood from the table below, which breaks out the component contributions in more detail and over time. In the table below we have split the "C" component into goods and services, split the "I" component into fixed investment and inventories, separated exports from imports, added a line for the BEA's "Real Final Sales of Domestic Product" and listed the quarters in columns with the most current to the left :
Summary and Commentary
For the most part, the nearly unchanged headline number reflects the "statistical noise" character of this report. Once again, the deflator being used minimizes the headline number -- simultaneously deflating conspiracy theories about the politically motivated tweaking of the underlying assumptions.
While this is not exactly "happy days are here again," it is also clearly not doom and gloom. Nor is the US economy -- by itself -- strong enough to pull the global economy out of a global economic funk.
This may be what an inflection point feels like.
Disclosure: None.


